Get $750 off your Tesla Powerwall 3: Rebate Now Available (Combine with Federal Subsidy Today)
Get $750 off your Tesla Powerwall 3: Rebate Now Available (Combine with Federal Subsidy Today)
Posted 15 Sep
Want the latest in energy, solar, and savings?Subscribe to our newsletter – we don’t spam!
With the rapid uptake of solar and now battery storage throughout Australia, data shows us the increase in adoption of renewable technologies with each state reaching new highs and statistics. Recently, the Clean Energy Council, Energy Council, and the Clean Energy Regulator have released solar and battery data and statistics for each state in Australia for Q2 of 2025, sharing data into how Australia is performing.
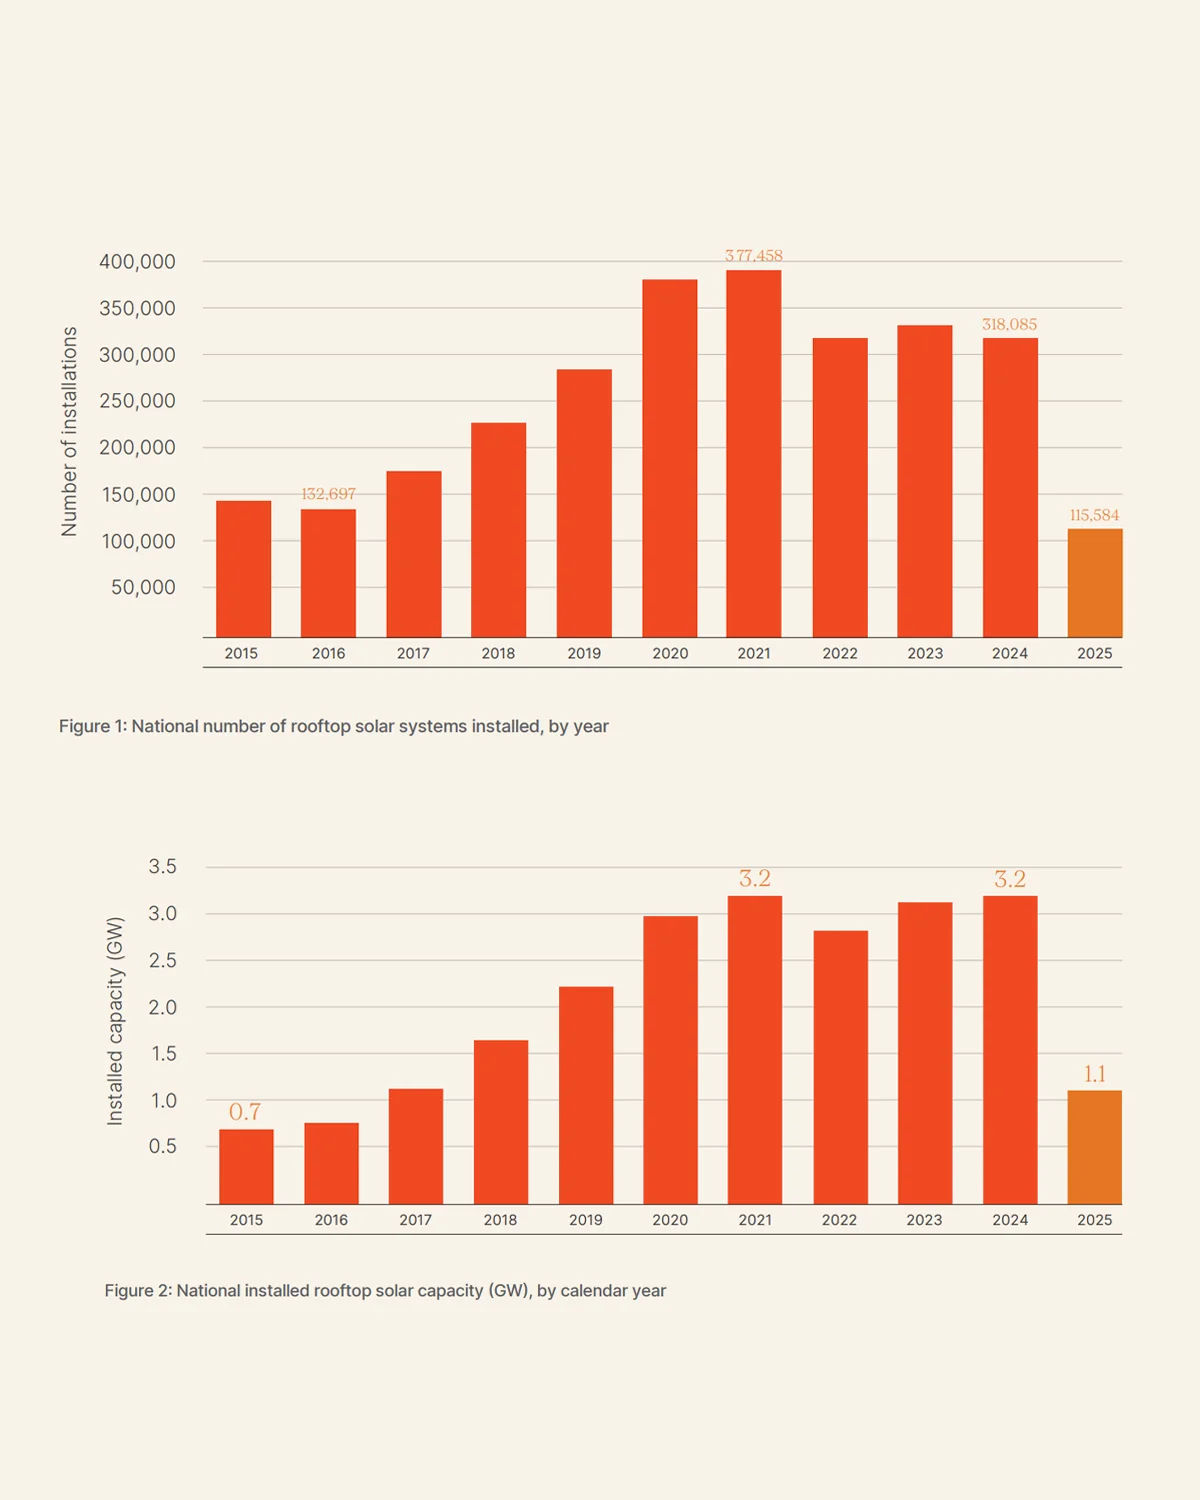
In the first half of 2025, there were 115,584 rooftop solar installations, according to the Clean Energy Council's Jan-Jun solar statistic 2025 report.
Even though the solar installation total was 18% lower than the 12 months prior, rooftop solar contributed 12.8% in generation share compared to 11.5% the year prior.
Accompanying the total of 1 GW of large-scale solar projects, the total capacity of installed rooftop solar reached 1.1 GW in the first half of 2025, with 4.2 million systems which produce 26.8GW of renewable generation.
New South Wales continues to have the highest installed rooftop solar capacity at 7.5 GW (over a quarter of Australia's capacity). However, Queensland saw the highest amount of total capacity installation in a 6-month period, reaching 326 MW compared to NSW's 321 MW.
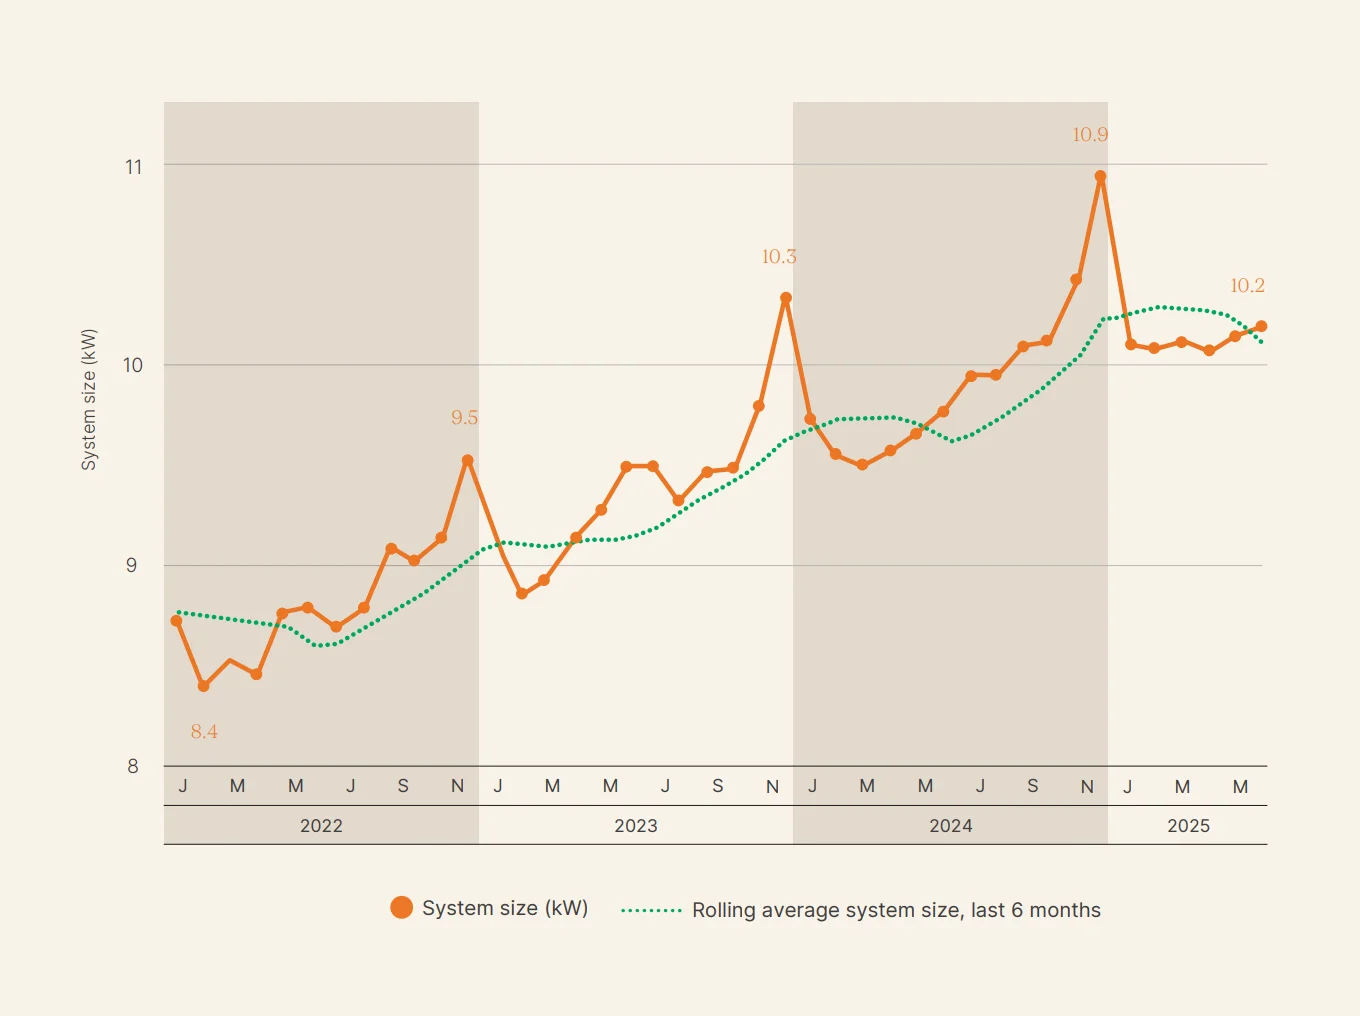
The average installed solar system size has continued to increase year-on-year.
Increasing 4.1% compared to 12 months prior, the 6-month rolling average grew to 10.2kW per solar system installation.
In conjunction with typical yearly patterns, solar installation and capacity dipped during mid-year months around wintertime, and begins to increase as warmer weather arrives, increasing from last year’s results.
Comparing the average solar system sizes in the second quarter of each year since 2017, it displays an upward trend in average system size.
The Northern Territory had the biggest growth and highest national average at 14.1kW, which is most likely due to the reduction of total system installations and increase in larger systems in the commercial and off-grid sectors.
NSW, ACT, SA, and QLD all resulted in averages surpassing more than 10kW, projecting strong growth in solar adoption, particularly in the commercial side of things.
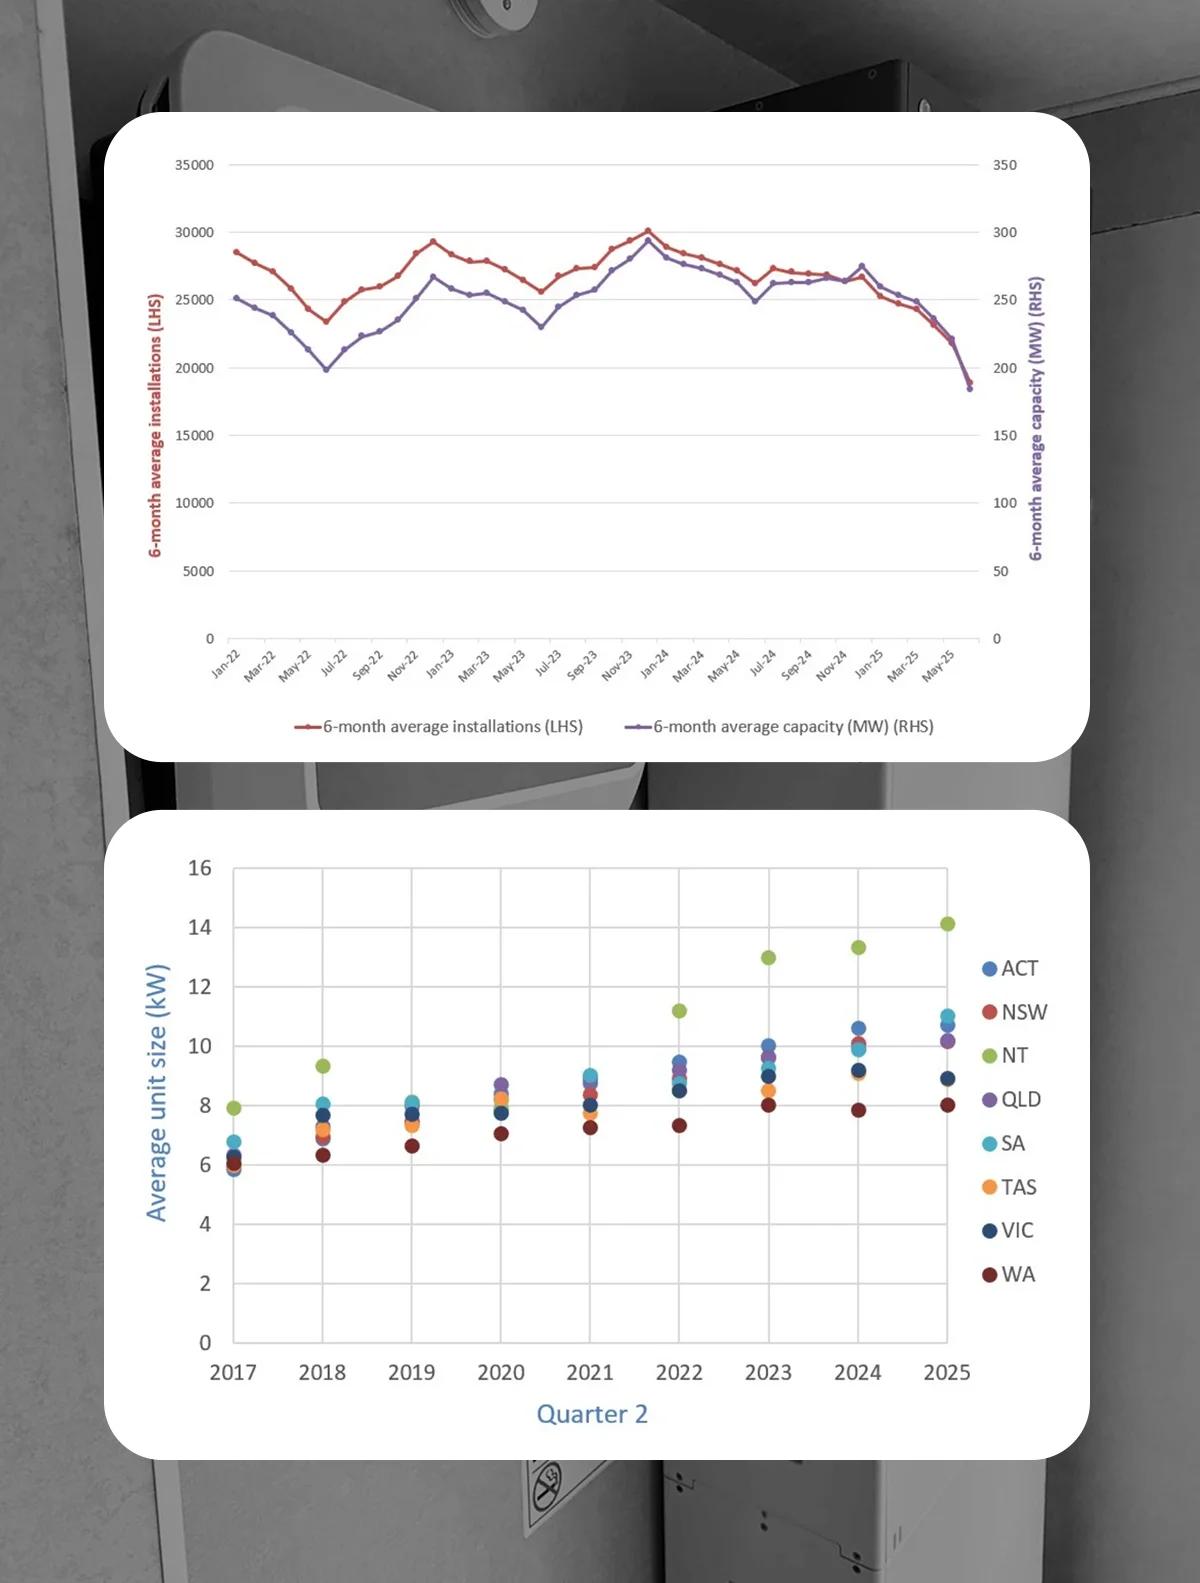
Courtesy of the Energy Council.
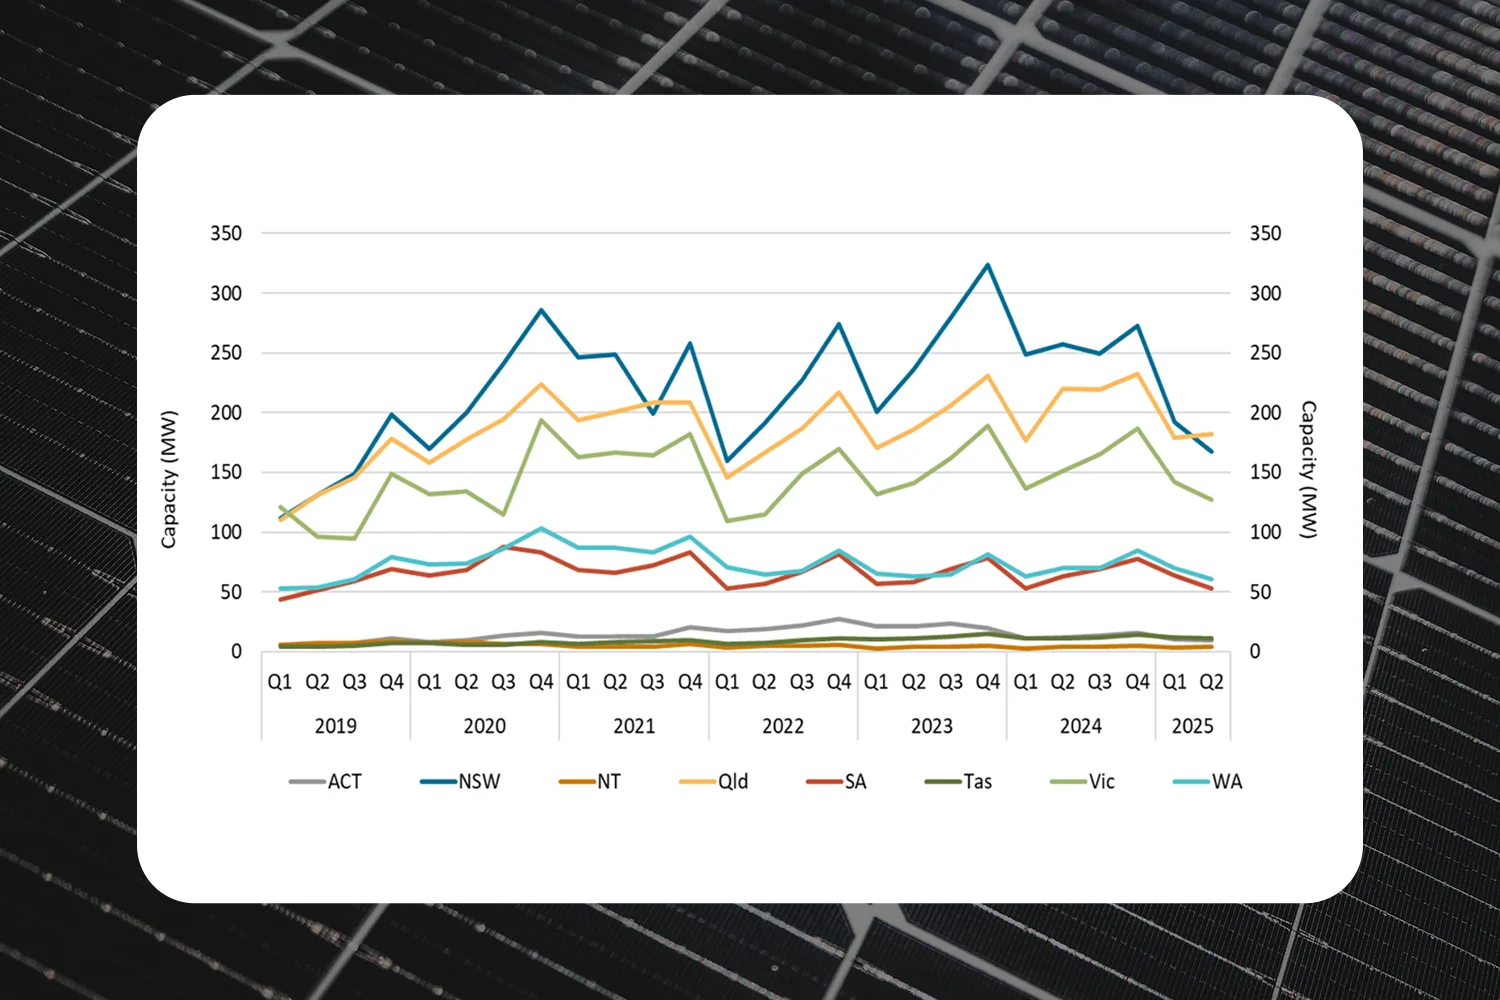
Rooftop solar capacity installed under the Small-scale Renewable Energy Scheme by state and territory over 2019-2025 - Data courtesy of
Clean
Energy Regulator.
As time continues, more older systems are becoming outdated and require replacements which contributes to a portion of the total amount
of installed systems. The Clean Energy Regulator’s Q2 2025 data workbook gives us some estimated data around how solar
system replacements
contribute to the total installation numbers across each state in Australia.
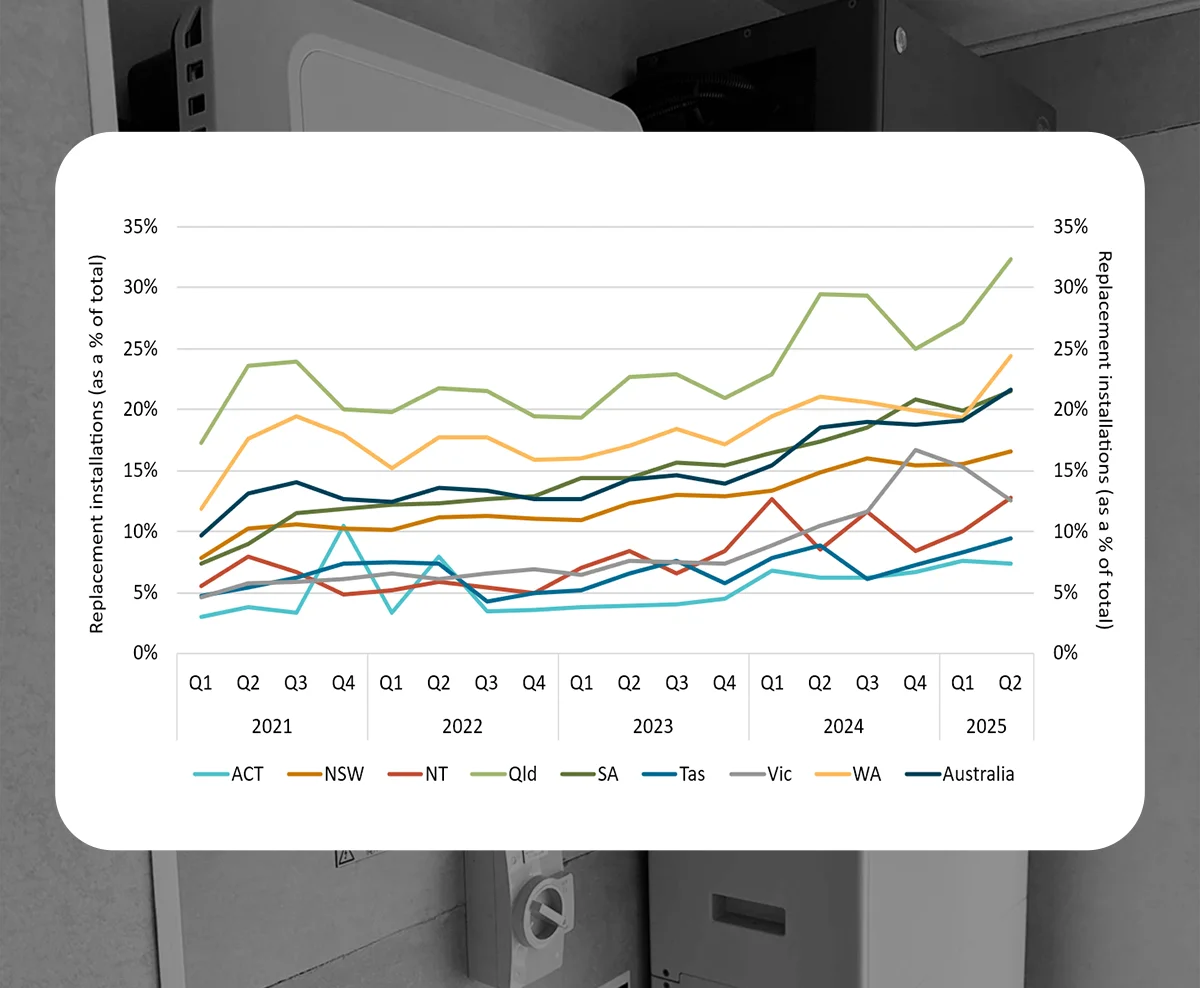
Since 2021, Australia’s solar system replacement portion has increased from 10% of systems, to 22% of the total installations being replacement system installations.
Comparing the second quarter of 2025 with other second quarters, we see that the figure of solar replacements has been slowly increasing, and QLD having the highest replacement rate of 32%.
New South Wales figures have been slowly increasing over the past 5 years, resulting in 17% of total solar system installations being replacements.
With older systems consisting of older technology which isn’t as durable as modern components, we expect this number to continue to increase slowly over time.
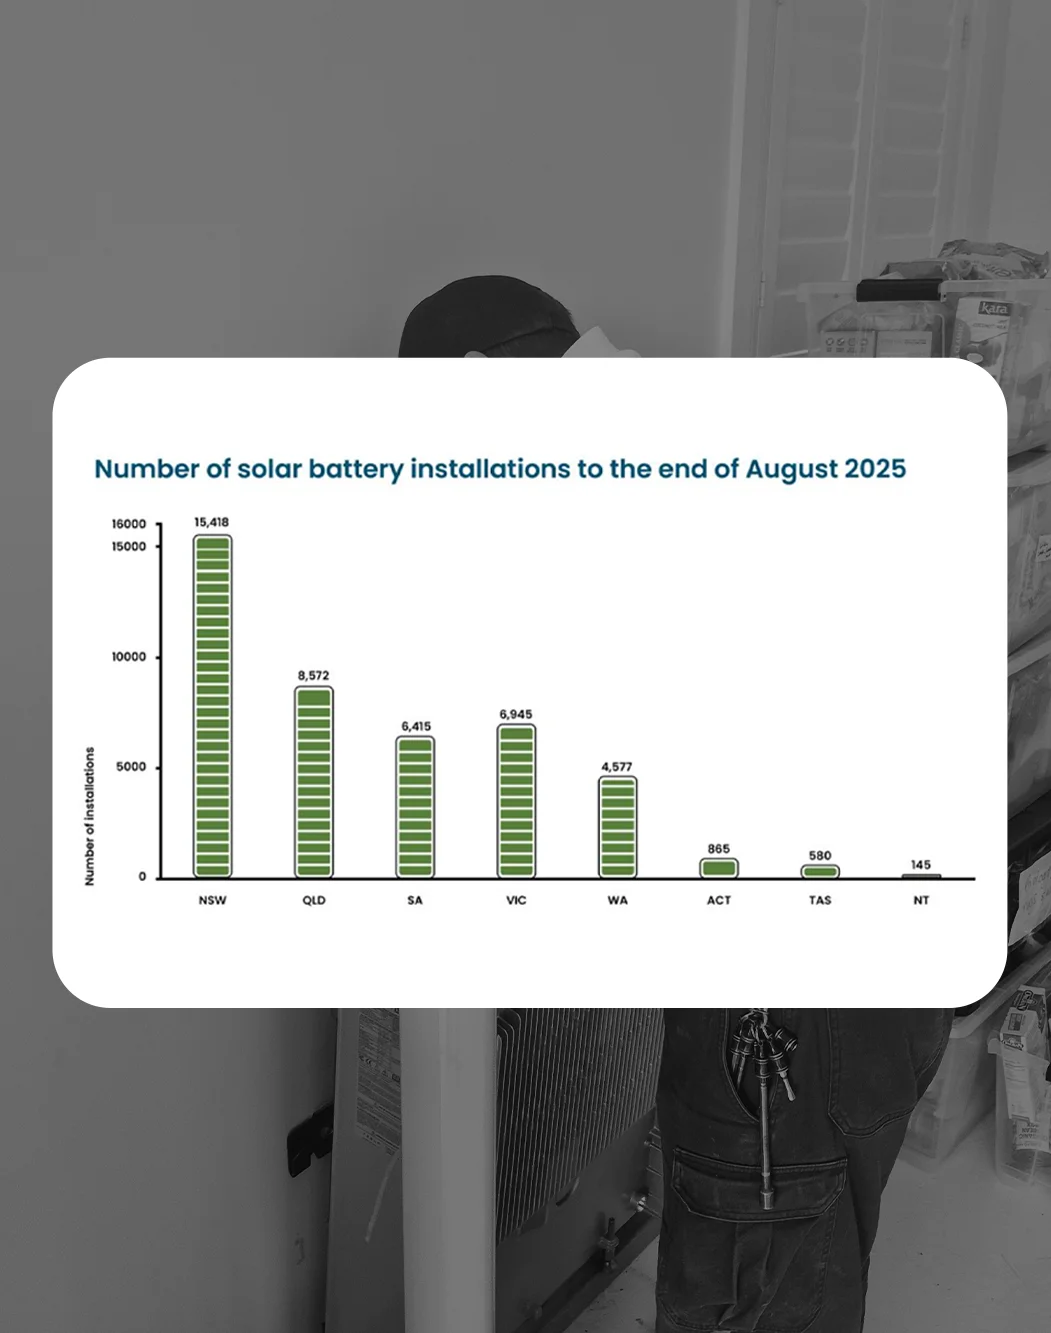
Since the Federal Battery Subsidy initiation on July 1st, 2025, New South Wales saw 15,418 solar battery installations. Queensland also had 8,572 installations, South Australia had 6,415, and Victoria installed 6,945 solar battery units.
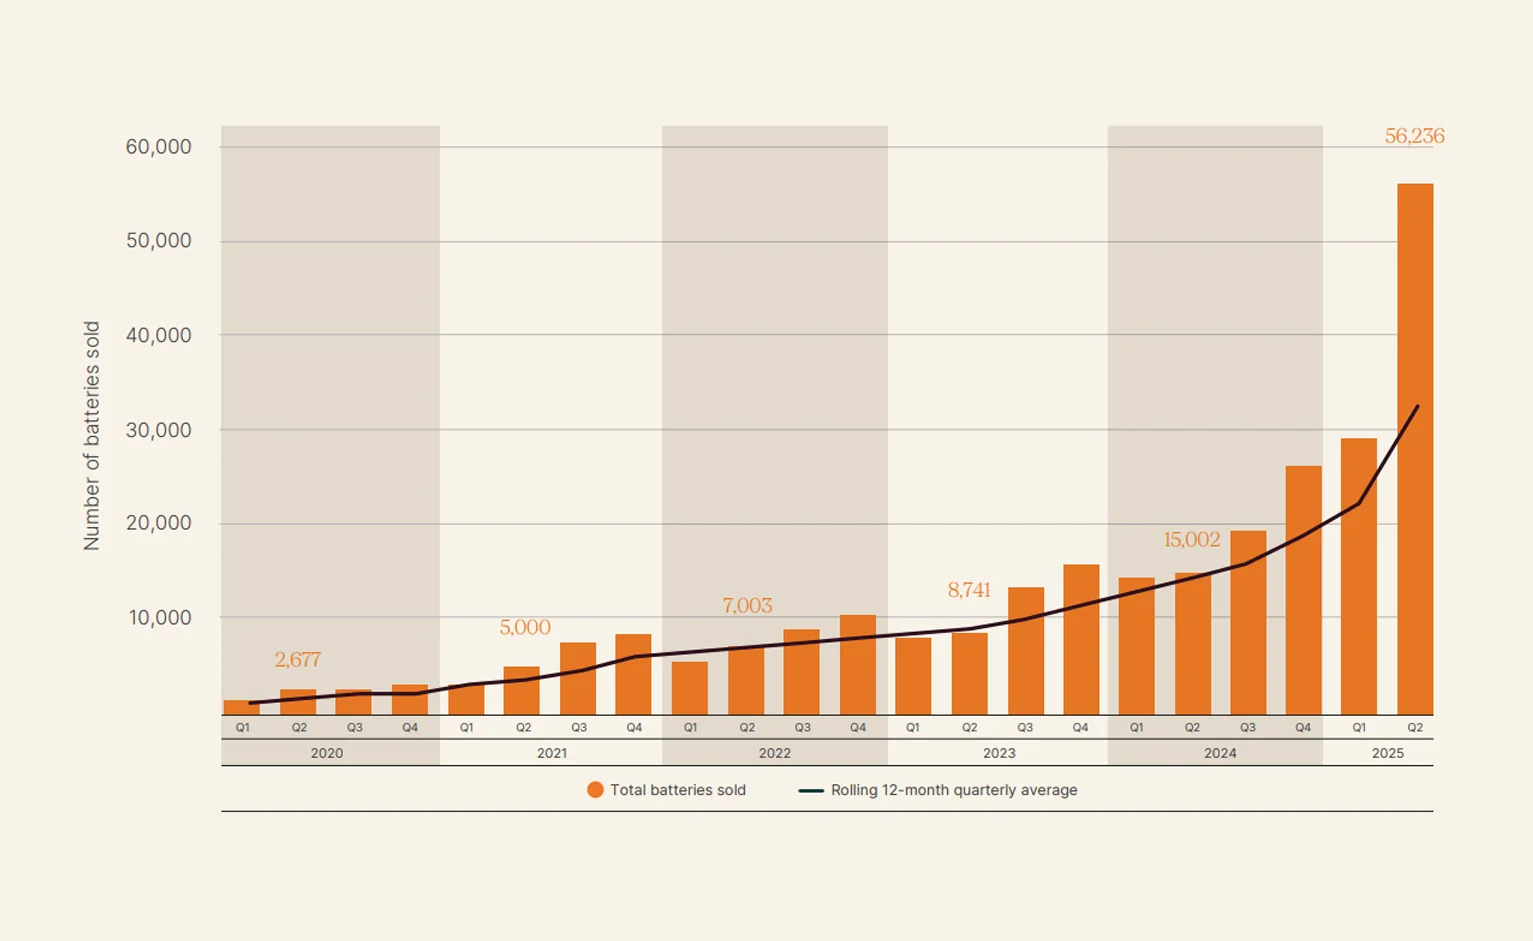
In the first 6-months of 2025, there were 85,000 battery storage sales in Australia, reaching a 191% increase from the same period last
year with the initiation of Australian and WA battery incentives. There have now been 271,000 solar batteries installed cumulatively across
Australia.
According to a recent report from the Clean Energy Regulator (CER), there have been over 23,925 more battery units installed in August 2025.
Whilst originally reporting on 19,592 solar battery installations totalling 356.5 MWh in July alone, the CER’s new report resulted in over 23,925 more solar batteries installed alongside new and existing solar systems since July 1, now totalling 825 MWh of capacity.
It’s also important to note that these numbers include approved and pending applications for STC’s, and don’t include failed applications or those who have applied yet.
These numbers show us a strong demand for solar battery storage from Australians, particularly after the start of the Cheaper Home Batteries Program incentive.
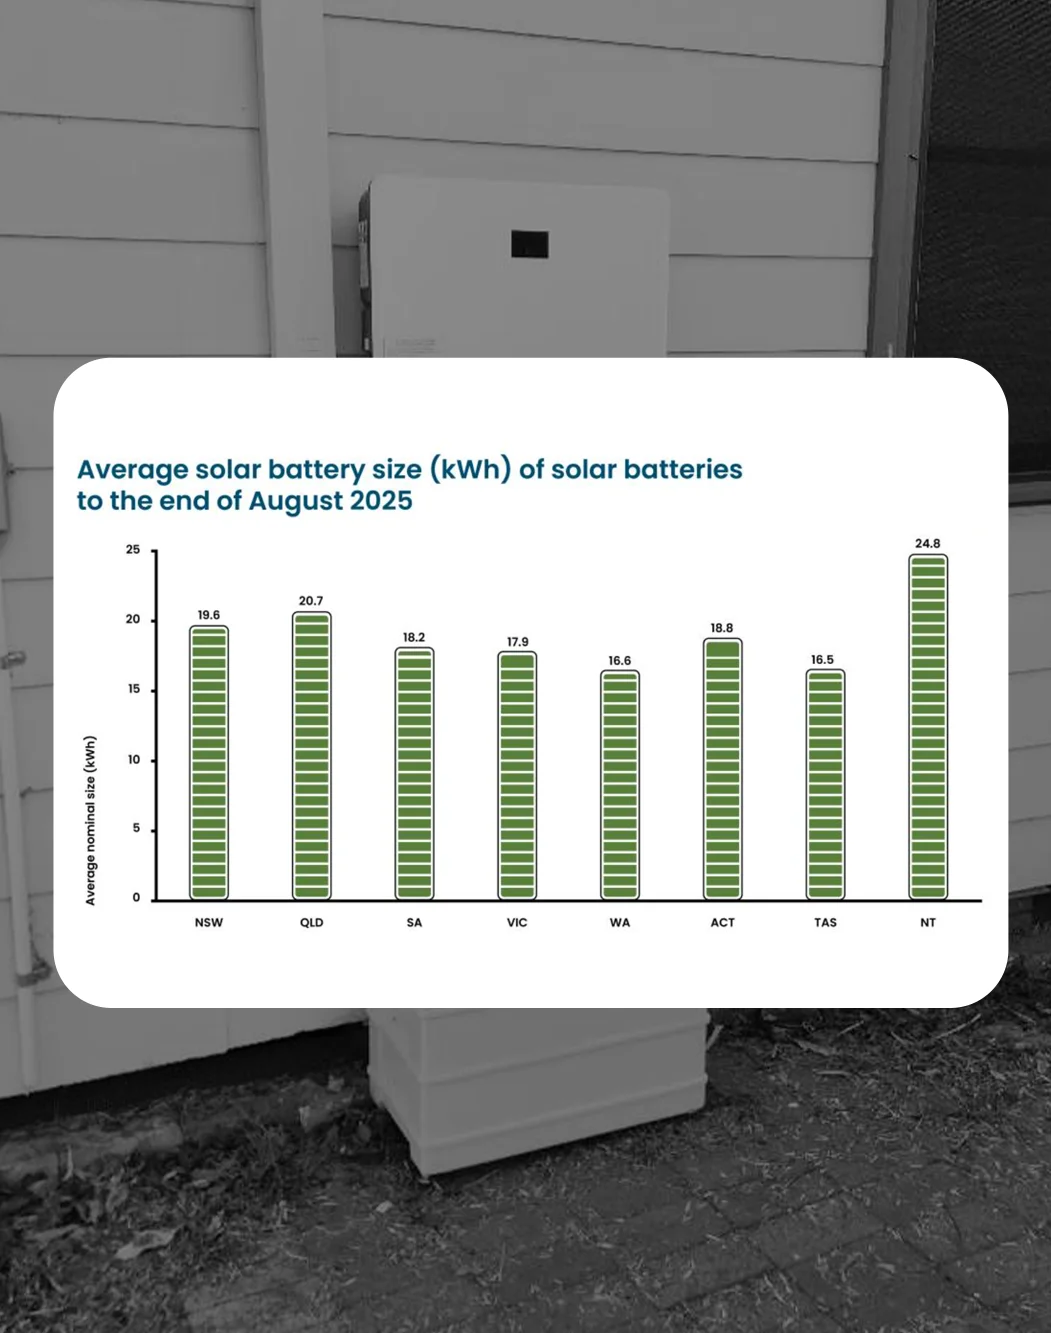
Australia’s national average nominal installed battery size has increased to 19kWh.
Since July 1st, 2025, Australia saw 43,517 new solar battery installations, with NSW leading the charge at 15,418 installations
and an average of 19.6kWh, QLD consisting of 8,572 installations and an average of 20.7kWh.
NSW: 15,418 installations (19.6kWh average)
QLD: 8,572 installations (29.7kWh average)
SA: 6,415 installations (18.2kWh average)
VIC: 6,945 installations (17.9kWh average)
WA: 4,577 installations (16.6kWh average)
ACT: 865 installations (18.8kWh average)
TAS: 580 installations (16.5kWh average)
NT: 145 installations (24.8kWh average)
In addition to solar and battery statistics for Australia, a report from the Australian Energy Regulator has been released to show wholesale electricity data and highlights from Q2 2025. Here were solar and battery-related key findings.

With data and events being reported on, we can see both indicative and accurate information on how the uptake of solar and battery is, along with the overall transition to renewable electricity. Combining data from the Clean Energy Regulator, Council, and other Government entities, we can see where we sit as an industry, and reflect on the progress we've made.
Overall, the data is encouraging to see such a high adoption rate for both solar and battery systems which are designed to optimise
household and commercial energy usage. Whilst it may feel unchanging month-to-month, it's enlightening to see a strong upward trend.
Resources:
Clean Energy Council Jan-June 2025 Report
Clean
Energy Regulator (September Update) Report
Renewable News Articles
Not only are we specialists in solar power, but we pride ourselves in being leading installers in battery
storage, as well as EV charging for homes and businesses. For solar and battery systems, we offer both on and off-grid solutions for a
range of applications.
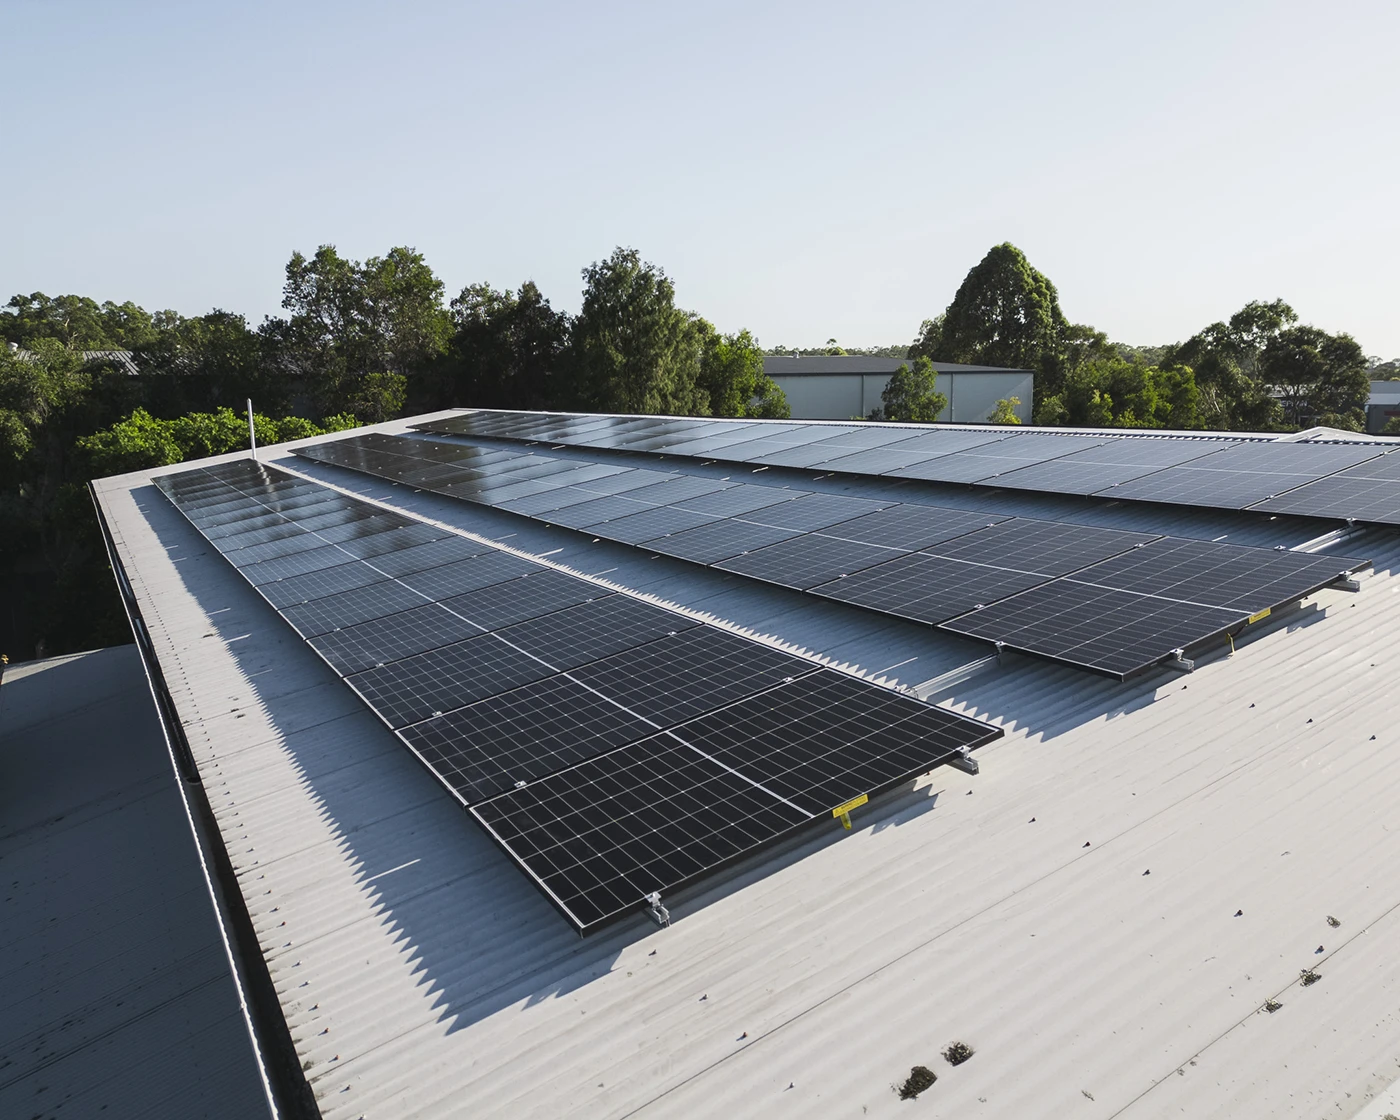
Newcastle's leading solar installers, providing long-lasting residential and commercial rooftop solar systems.
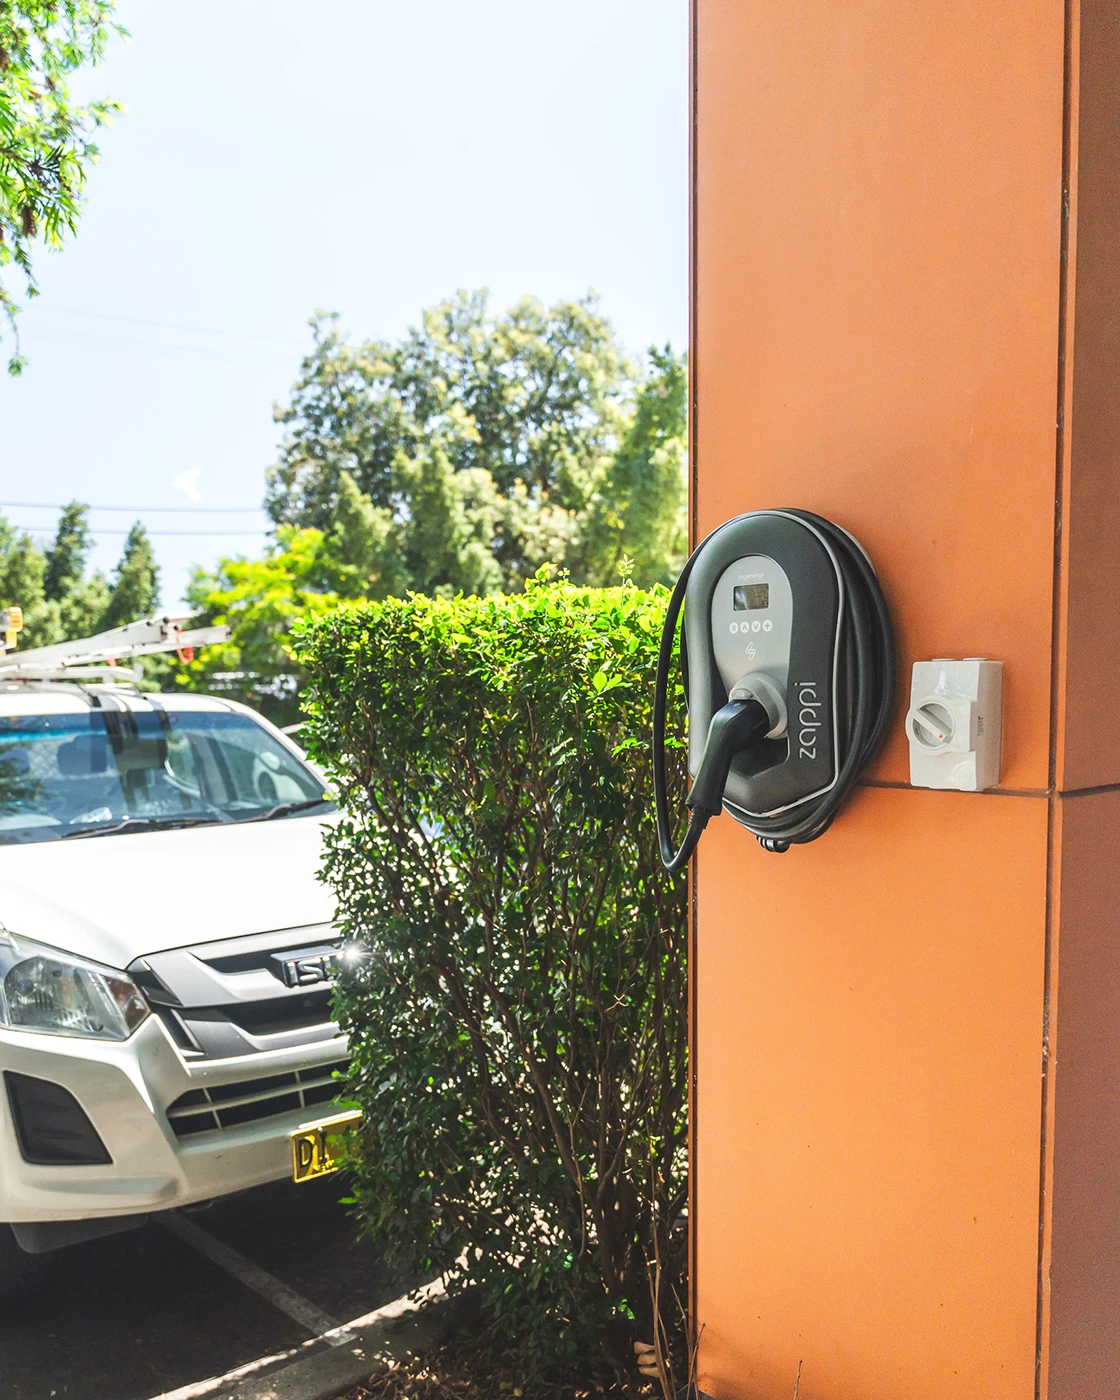
Experts in both residential and commercial electric vehicle charging station installations from 7kW - 360kW+.
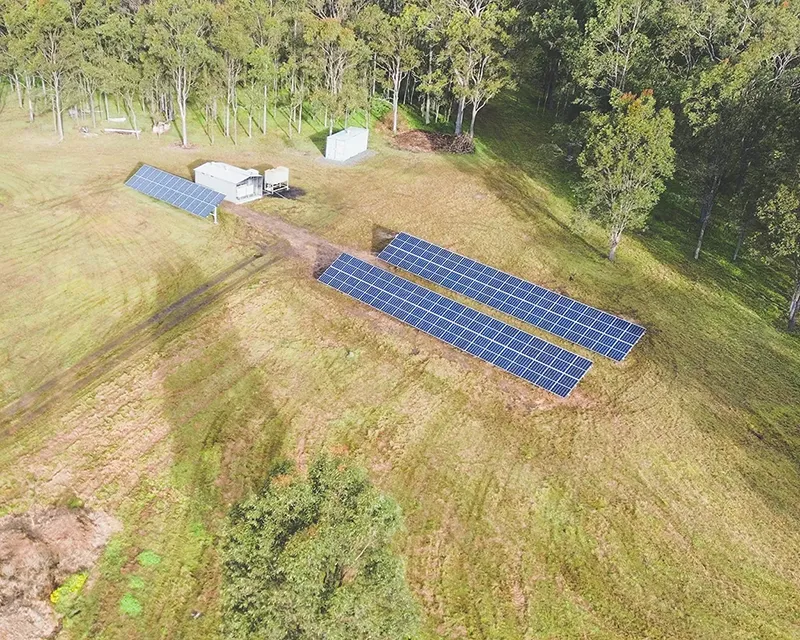
Specialists in off-grid solar and battery, helping properties never have to pay another electricity bill again.
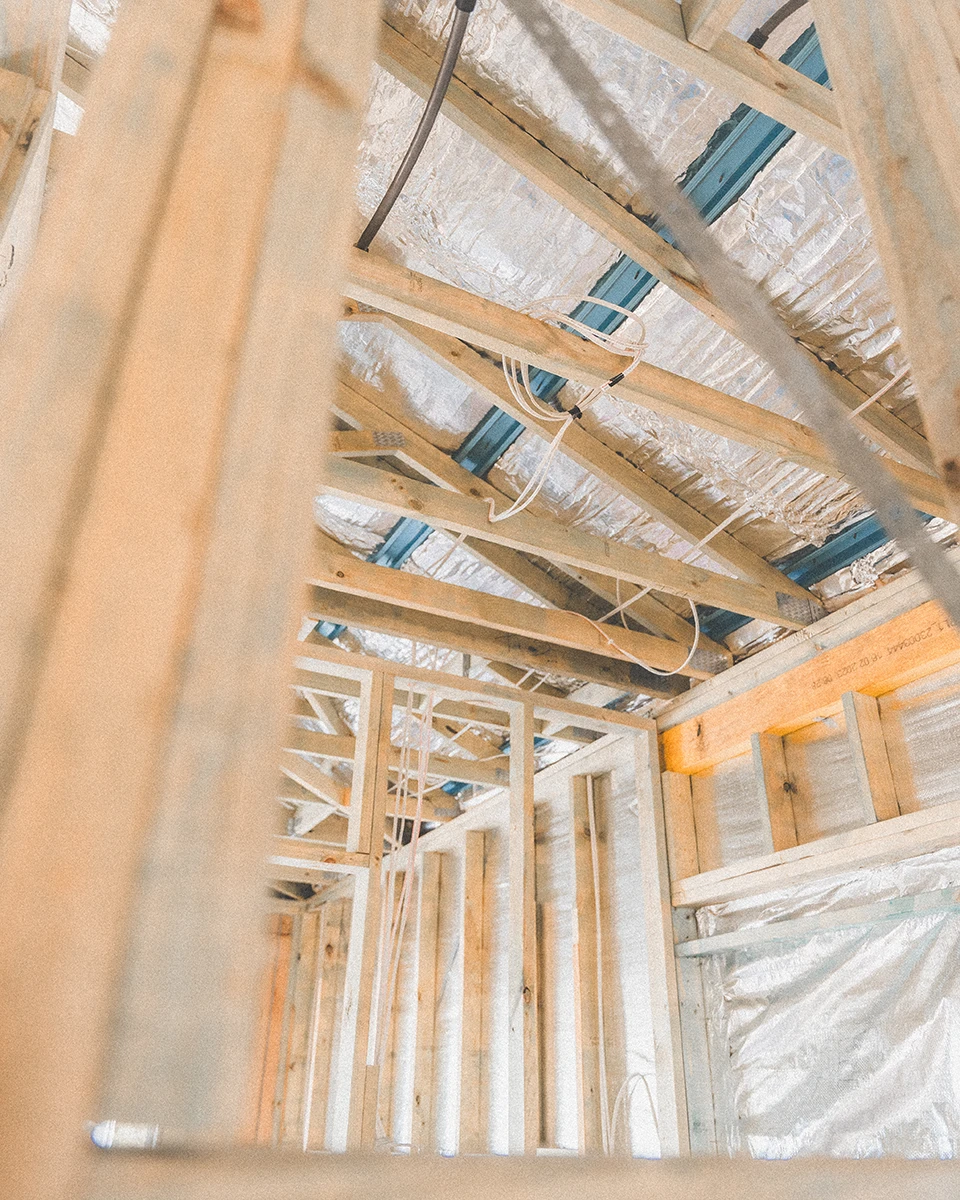
With decades of electrical and industry experience, our fully-qualified & licensed electricians are here to help.
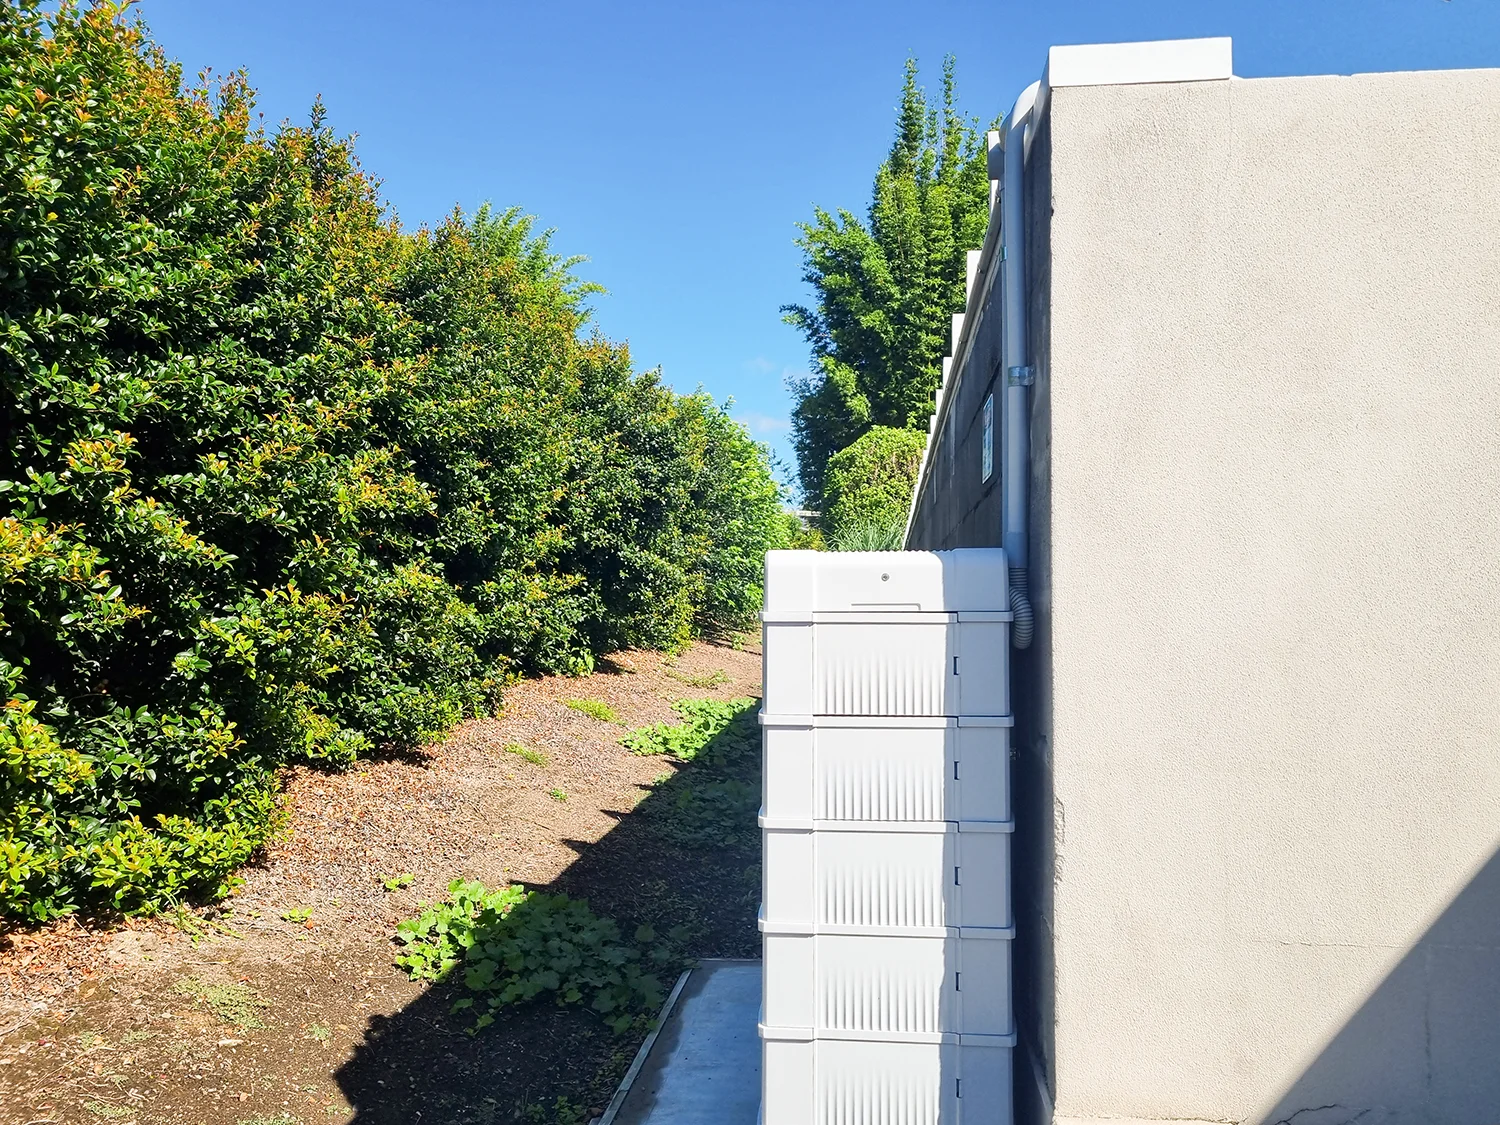
Maximise your solar generation with battery storage from reputable brands to accelerate return-on-investment.
Leave a Comment