Hunter Valley's Leading Residential & Commercial Solar Installers
Hunter Valley's Leading Residential & Commercial Solar Installers
Posted 29 Jul
Want the latest in energy, solar, and savings?Subscribe to our newsletter – we don’t spam!
If you have solar and your bills spike every winter, you are not imagining it. A solar system in Newcastle or the Hunter generates roughly twice as much electricity in December as it does in June. That is not a fault or a coincidence - it is physics. The sun sits lower in the sky in winter, the days are shorter, and the combination hits your solar output harder than most people expect when they sign up for solar.
Understanding how your system performs through the seasons lets you manage your energy use more intelligently, get more from what you generate, and stop being surprised by your quarterly bill. This guide covers the actual numbers for the NSW Hunter region, what drives the difference, and what you can do about it at each time of year.
Quick answer: In winter, your solar system generates around 35% less because the sun sits lower in the sky and the days are shorter. In Newcastle, the sun reaches about 78 degrees above the horizon at midday in December and only around 31 degrees in June. That lower arc means less solar energy hits your panels per hour, and fewer hours of generation overall.
A solar system size like '6.6kW' refers to its maximum solar power output under ideal conditions. A 6.6kW system will produce up to 6.6kW when the sun is at its strongest position on your roof - otherwise known as peak sun hours.
Taking into account real-world factors like system losses and inefficiencies, your actual peak output will be a little lower. It's also important to note that the actual solar power you receive depends on your inverter size. If a 6.6kW system has a 5kW inverter, the maximum usable solar output would be 5kW.
Sitting around 33 degrees south, Newcastle is positioned well for peak sun hours to maximise solar production. A north-facing solar system here is well-placed to harness peak irradiance across as much of the day as possible.
In Summer, Australia tends to see around 6-7 hours of peak sunlight per day, where Winter is around 3.5-5 hours. This gap is generally why you see lesser performance during Winter months.

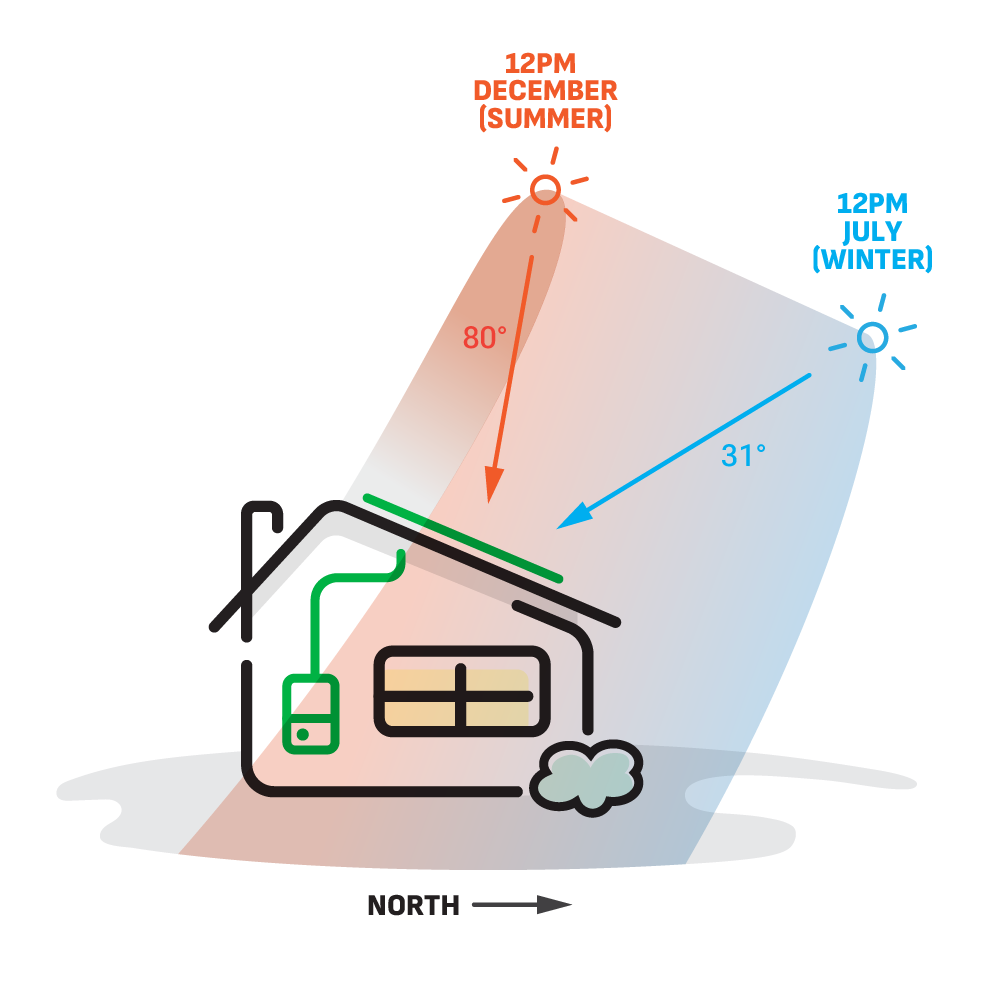
Yes, solar is significantly better in summer. During summer, systems generally reach their optimal performance.
In summer, the sun rises south-east and arcs across the northern sky and sets in the south-west. Not only does this mean that the sun is a better position for peak sunlight exposure to the solar panels, but the sunlight hours last longer too reaching around 7-8 hours on average in NSW.
In Winter, the sun peaks at around 31 degrees at midday and sets earlier which leaves less time for solar generation and reducing overall system performance by around 35%.
Because of the tigher window of solar production in winter, households have to pay closer attention to when they use their appliances to maximise self-consumption.
The shift from winter to summer and back is gradual, not a switch. Understanding how your system ramps through spring, and drops through autumn - helps you set realistic expectations and spot genuine underperformance versus normal seasonal variation.
| Month | Peak sun hours | 6.6kW system | 10kW system | 13.3kW system |
|---|---|---|---|---|
| January | 5.2–5.5 | 32–36 kWh | 48–55 kWh | 64–73 kWh |
| February | 4.8–5.2 | 30–33 kWh | 45–50 kWh | 60–67 kWh |
| March | 4.2–4.6 | 26–30 kWh | 39–45 kWh | 52–60 kWh |
| April | 3.8–4.2 | 22–26 kWh | 33–39 kWh | 44–52 kWh |
| May | 3.2–3.6 | 20–23 kWh | 30–35 kWh | 40–46 kWh |
| June | 3.0–3.3 | 19–22 kWh | 29–33 kWh | 38–44 kWh |
| July | 3.1–3.5 | 20–23 kWh | 30–35 kWh | 40–46 kWh |
| August | 3.6–4.0 | 23–26 kWh | 35–39 kWh | 46–52 kWh |
| September | 4.0–4.4 | 25–29 kWh | 38–44 kWh | 50–58 kWh |
| October | 4.5–4.9 | 28–32 kWh | 42–48 kWh | 56–64 kWh |
| November | 4.8–5.2 | 30–34 kWh | 45–52 kWh | 60–69 kWh |
| December | 5.0–5.4 | 32–36 kWh | 48–55 kWh | 64–73 kWh |
Source: BoM solar exposure data.
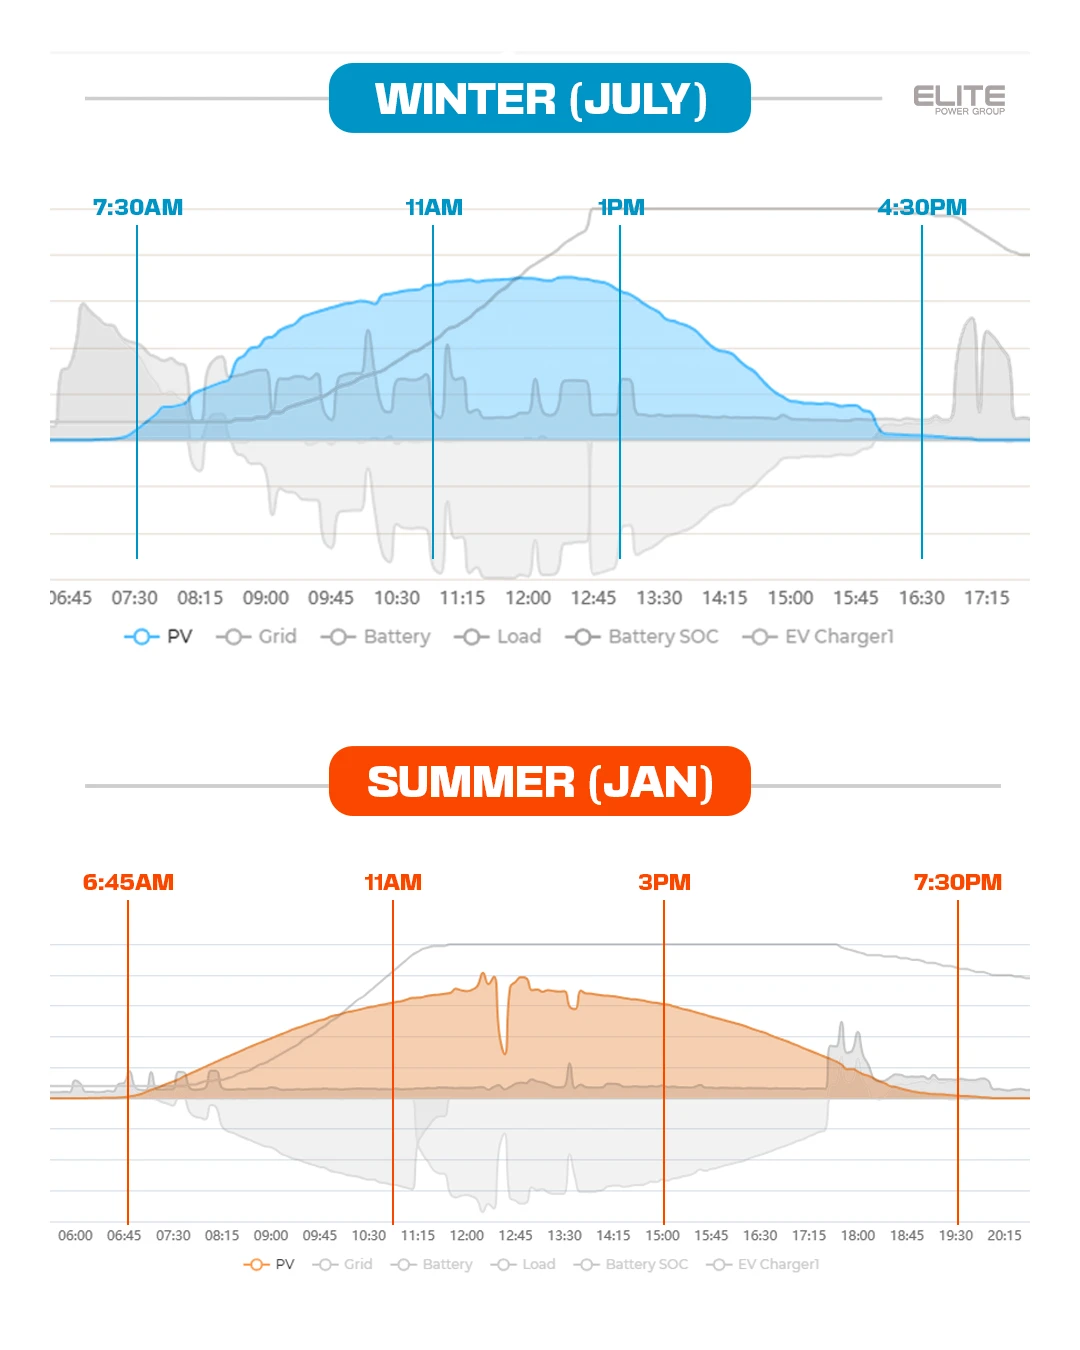
A solar systems daily generation is closely tied with the angle of the sun throughout the day. Here are winter vs. summer solar system graphs to compare.
Throughout summer, the suns' pathway is broader and has more hours either side of midday which corrolates into increase solar production. In winter the curve is narrower and peaks for fewer hours.
During winter months, the sun starts to rise around 7:30am, peaks between 11am-12:45pm producing the most solar energy, then sets at around 4:30pm.
In summer months, the sun rises around 6:45am, and peaks in solar production between 11am-3pm, and tapers around 7pm.
Overall, the highest time of day for solar generation is around 10am-2pm throughout every season.
The orientation of a solar system can either make or break its performance.
Whilst most solar systems in NSW are north-facing, some homeowners opted to have their east and west roof face covered in solar as it helps you get more out solar generation hours.
An east-facing solar array generates more in the morning and peaks earlier as the sun then shines more on the north-facing array. As the afternoon approaches, the west-facing array captures the late afternoon sun that the north array would otherwise miss.
This kind of setup enables longer solar exposure and helps offset early and later electricity consumption. For households with batteries that are charged throughout the day by the north-facing array most likely won't need east and west-facing solar arrays.
What happens if my solar isn't north-facing? For solar systems that are not north-facing, this can significantly impact overall performance and return-on-investment.
Daylight savings does not affect how much solar you generate. However, it does effect the time you use it.
When daylight savings hits, it combines the longer days with an extended afternoon where dinner and other 'evening' activities can be absorbed by solar that is still generating.
Generally, households generate lots of solar power during the day and then rely on the grid to cook, wash their clothes, or use other high loads which is what results in high electricity bills.
Because time has been shifted into the afternoon, those who cook dinner at a normal hour can continue to use solar power where otherwise the sun would be down. So if used correctly, daylight savings can help you use more solar and save on your energy bills.
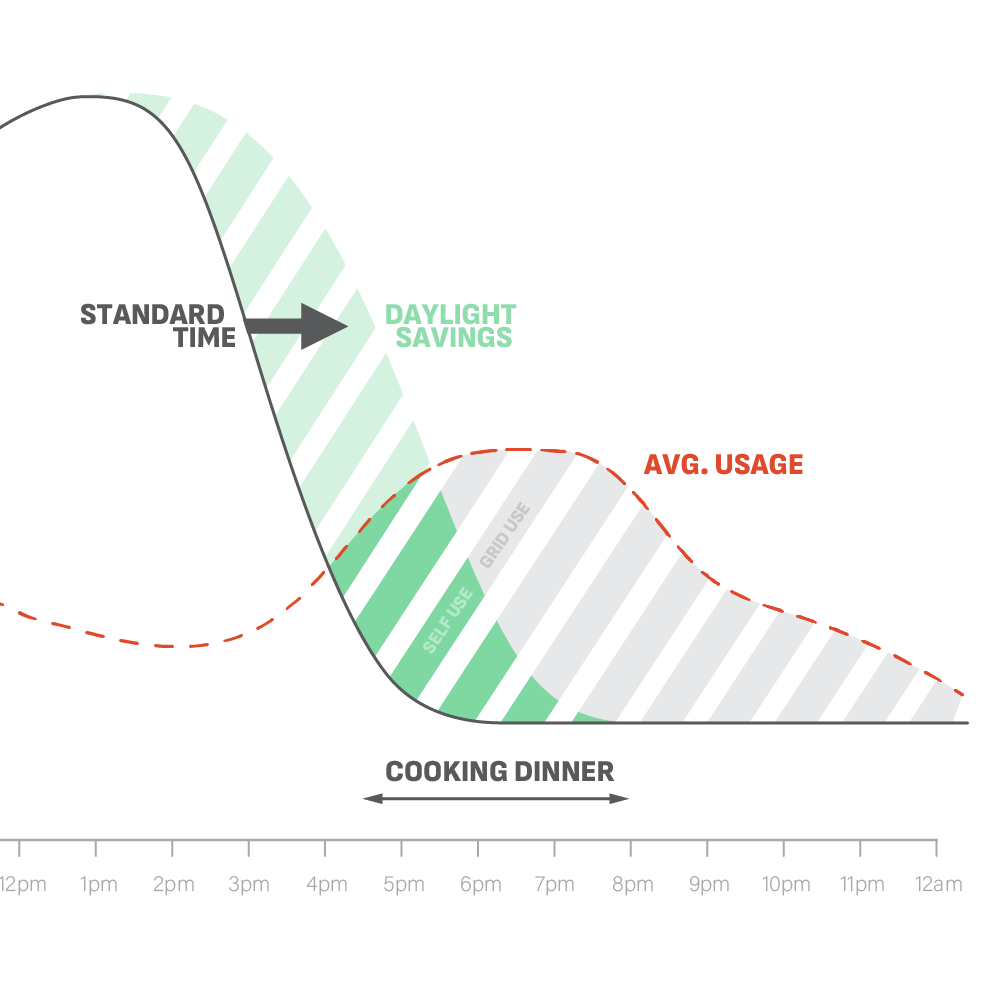
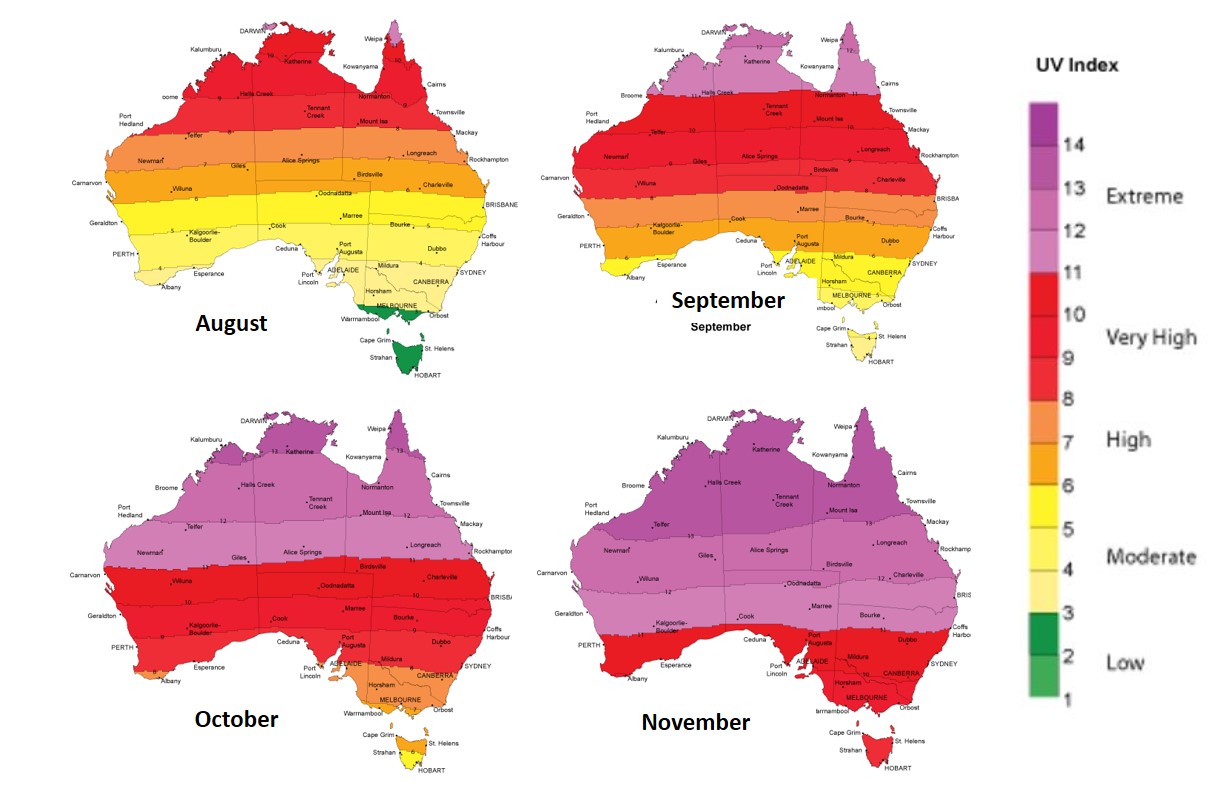 Image courtesy of bom.gov.au
Yes, ultraviolet (UV) levels can affect solar generation, but not in the way you’d expect.
Solar panels generate electricity predominately from visible and infrared light. Monocrystalline solar panels are designed to harness mostly visible light with infrared and a minor portion of UV.
Where UV light becomes more relevant is in its thermal relationship. During high UV periods like through our summers, they also come with high ambient temperatures where solar panels can lose their efficiency and negatively impact performance. Cooler panels, more efficiency.
Higher sustained UV exposure does accelerate panel degradation over time, particularly in older panels that don't have modern protective coatings. Modern panels use UV-resistant methods and anti-reflective glass goating that contribute to slowing down degradation.
Overall, no matter your system specifications or setup, your production will always vary throughout the year with different elements determining the output of your system.
Most solar systems average out to expected performance through the year with its highs and lows, but now you know how each season can affect your production.
Not all batteries provide blackout backup by default. Learn what happens, what your battery is backing up, and how to stop your battery draining too fast.
Read moreFind available rebates & subsidies for solar systems, battery storage, and VPPs in NSW. Explore eligibility and maximise live incentives today.
Read moreNot sure which battery matches your solar system? Compare solar & battery size combinations, from 6.6kW to 13.3kW+, & find the right fit in Newcastle.
Read more
Renewable News Articles
Sign up for new article updates - we don't spam.
We've invested in becoming fully-licensed and qualified installers to ensure Newcastle homes and businesses
get the best solar, battery, and electrical systems available. We want to assist Newcastle's renewable energy revolution with quality
installations for maximum customer satisfaction.
Certified solar system installers near you.
Get CEC-Approved Battery Installations.
Fully-licensed electricians in Newcastle.
Convenient EV charging stations for properties.
Leave a Comment