How Are Solar Panels Installed? A Step-by-Step Guide for NSW
All NSW homeowners need to know about the solar installation process - from first quote to first bill. 9 steps, real timeframes, & what to ask your installer.
Read more
Explore our Brand-new Resource Hub & Learn the Basics of Solar & Electrical
Posted 7 Nov
Want the latest in energy, solar, and savings?Subscribe to our newsletter – we don’t spam!
If you have solar and your bills spike every winter, you are not imagining it. A solar system in Newcastle or the Hunter generates roughly twice as much electricity in December as it does in June. That is not a fault or a coincidence - it is physics. The sun sits lower in the sky in winter, the days are shorter, and the combination hits your solar output harder than most people expect when they sign up for solar.
Understanding how your system performs through the seasons lets you manage your energy use more intelligently, get more from what you generate, and stop being surprised by your quarterly bill. This guide covers the actual numbers for the NSW Hunter region, what drives the difference, and what you can do about it at each time of year.
Quick answer: In winter, your solar system generates less because the sun sits lower in the sky and the days are shorter. In Newcastle, the sun reaches about 78 degrees above the horizon at midday in December and only around 31 degrees in June. That lower arc means less solar energy hits your panels per hour, and fewer hours of generation overall. A 6.6kW system that produces 30 to 36 kWh on a clear summer day will typically produce 20 to 23 kWh on an equivalent clear winter day. The system is working as it should — there is simply less sun to work with.
A solar system size like '6.6kW' refers to its maximum solar power output under ideal conditions. A 6.6kW system will produce up to 6.6kW when the sun is at its strongest position on your roof - otherwise known as peak sun hours.
Taking into account real-world factors like system losses and inefficiencies, your actual peak output will be a little lower. It's also important to note that the actual solar power you receive depends on your inverter size. If a 6.6kW system has a 5kW inverter, the maximum usable solar output would be 5kW.
Sitting around 33 degrees south, Newcastle is positioned well for peak sun hours to maximise solar production. A north-facing solar system here is well-placed to harness peak irradiance across as much of the day as possible.
In Summer, Australia tends to see around 6-7 hours of peak sunlight per day, where Winter is around 3.5-5 hours. This gap is generally why you see lesser performance during Winter months.


Yes, solar is significantly better in summer. During summer, systems generally reach their optimal performance.
In summer, the sun rises south-east and arcs across the northern sky and sets in the south-west. Not only does this mean that the sun is a better position for peak sunlight exposure to the solar panels, but the sunlight hours last longer too reaching around 7-8 hours on average in NSW.
In Winter, the sun peaks at around 31 degrees at midday and sets earlier which leaves less time for solar generation and reducing overall system performance by around 30-45%.
Because of the tigher window of solar production in winter, households have to pay closer attention to when they use their appliances to maximise self-consumption.
The shift from winter to summer and back is gradual, not a switch. Understanding how your system ramps through spring, and drops through autumn - helps you set realistic expectations and spot genuine underperformance versus normal seasonal variation.
| Month | Peak sun hours | 6.6kW system | 10kW system | 13.3kW system |
|---|---|---|---|---|
| January | 5.2–5.5 | 32–36 kWh | 48–55 kWh | 64–73 kWh |
| February | 4.8–5.2 | 30–33 kWh | 45–50 kWh | 60–67 kWh |
| March | 4.2–4.6 | 26–30 kWh | 39–45 kWh | 52–60 kWh |
| April | 3.8–4.2 | 22–26 kWh | 33–39 kWh | 44–52 kWh |
| May | 3.2–3.6 | 20–23 kWh | 30–35 kWh | 40–46 kWh |
| June | 3.0–3.3 | 19–22 kWh | 29–33 kWh | 38–44 kWh |
| July | 3.1–3.5 | 20–23 kWh | 30–35 kWh | 40–46 kWh |
| August | 3.6–4.0 | 23–26 kWh | 35–39 kWh | 46–52 kWh |
| September | 4.0–4.4 | 25–29 kWh | 38–44 kWh | 50–58 kWh |
| October | 4.5–4.9 | 28–32 kWh | 42–48 kWh | 56–64 kWh |
| November | 4.8–5.2 | 30–34 kWh | 45–52 kWh | 60–69 kWh |
| December | 5.0–5.4 | 32–36 kWh | 48–55 kWh | 64–73 kWh |
Source: BoM solar exposure data.
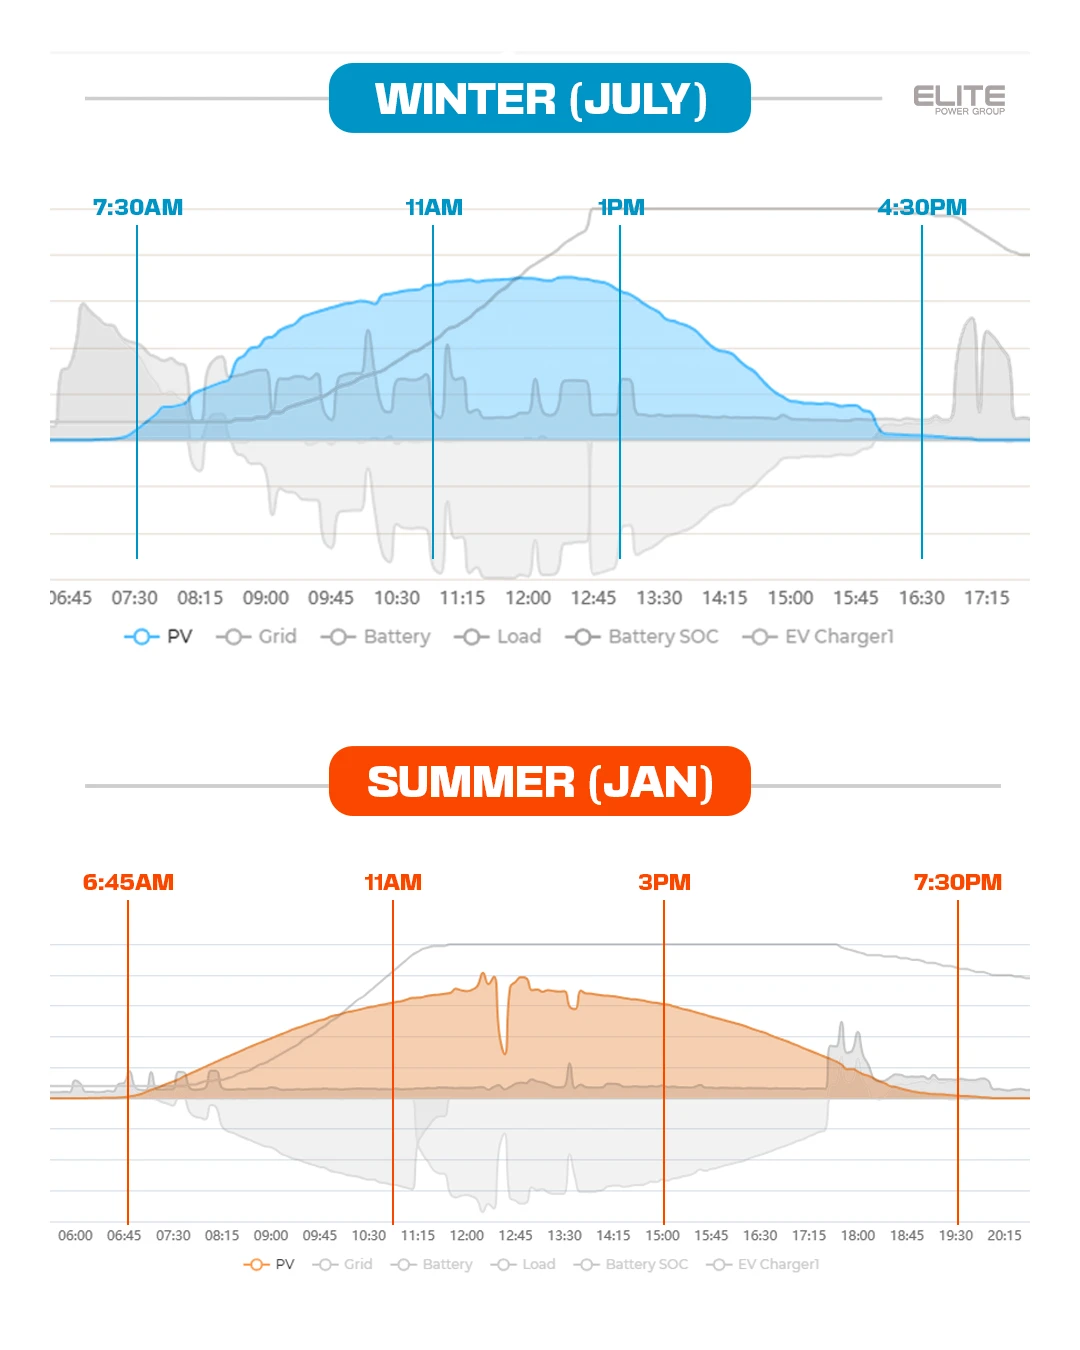
A solar systems daily generation is closely tied with the angle of the sun throughout the day. Here are winter vs. summer solar system graphs to compare.
Throughout summer, the suns' pathway is broader and has more hours either side of midday which corrolates into increase solar production. In winter the curve is narrower and peaks for fewer hours.
During winter months, the sun starts to rise around 7:30am, peaks between 11am-12:45pm producing the most solar energy, then sets at around 4:30pm.
In summer months, the sun rises around 6:45am, and peaks in solar production between 11am-3pm, and tapers around 7pm.
Overall, the highest time of day for solar generation is around 10am-2pm throughout every season.
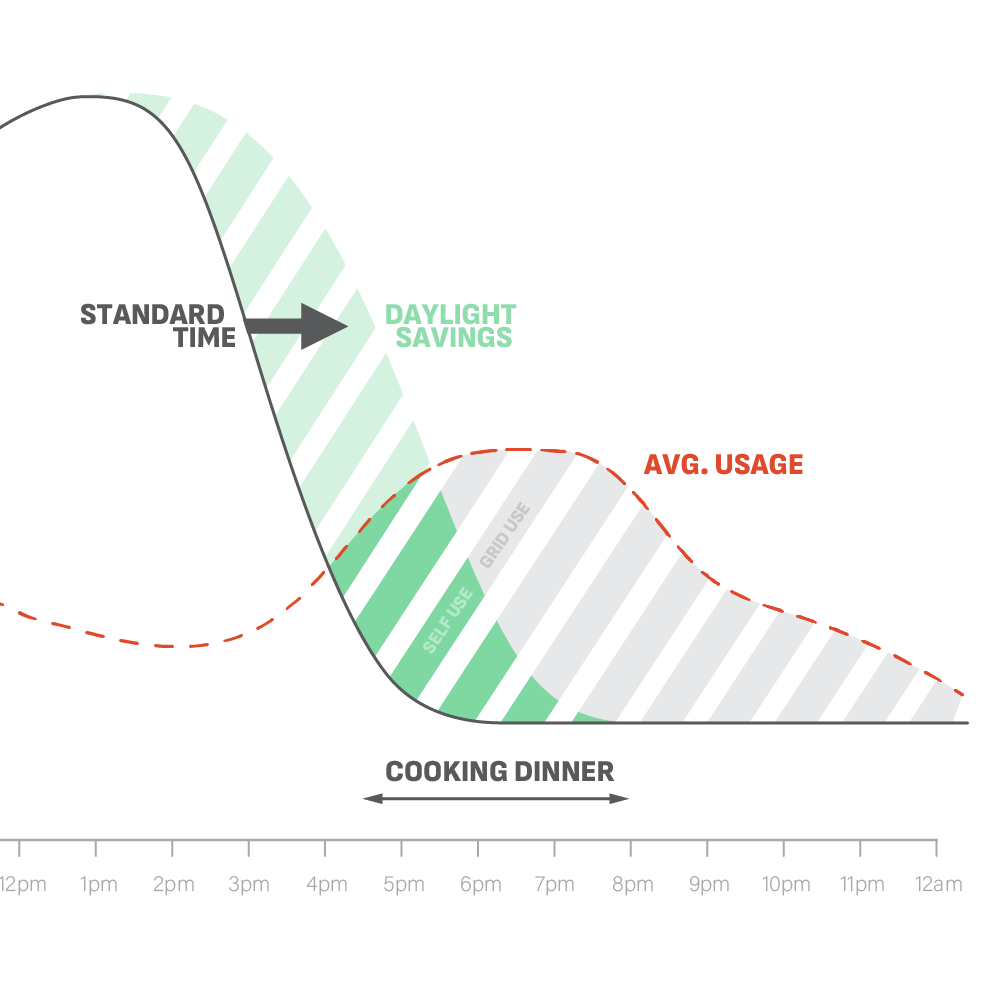
Daylight savings does not affect how much solar you generate. However, it does effect the time you use it.
When daylight savings hits, it combines the longer days with an extended afternoon where dinner and other 'evening' activities can be absorbed by solar that is still generating.
Generally, households generate lots of solar power during the day and then rely on the grid to cook, wash their clothes, or use other high loads which is what results in high electricity bills.
Because time has been shifted into the afternoon, those who cook dinner at a normal hour can continue to use solar power where otherwise the sun would be down. So if used correctly, daylight savings can help you use more solar and save on your energy bills.
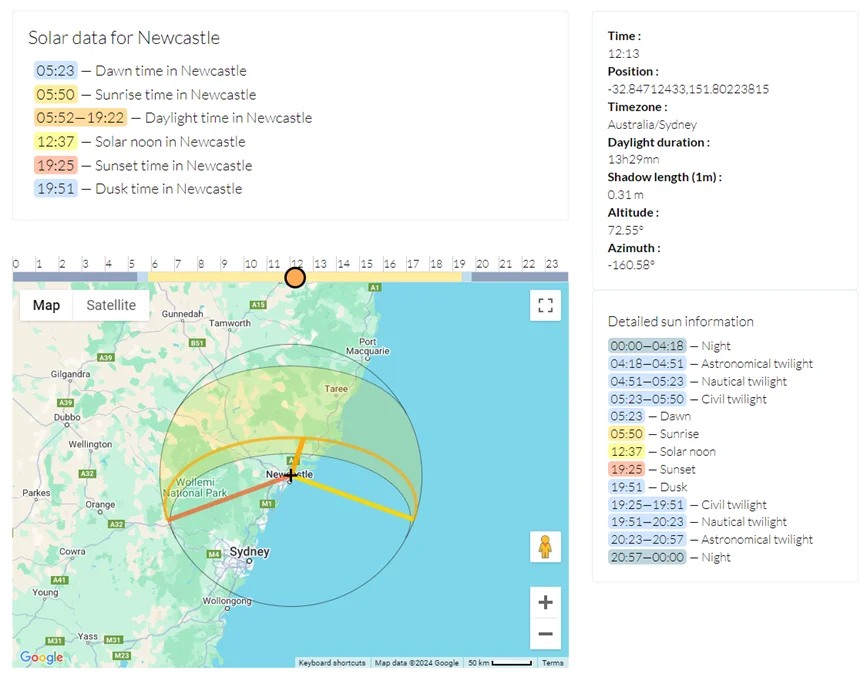
Image courtesy of sun-direction.com
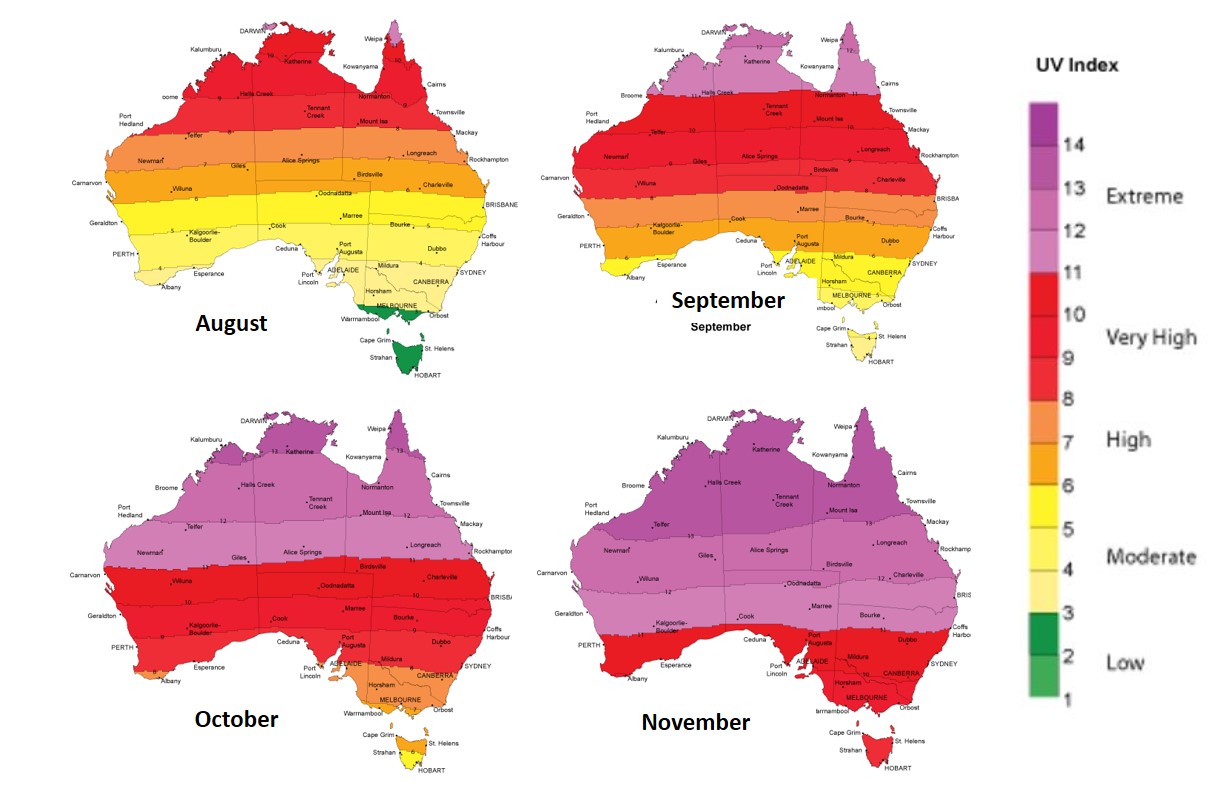
Yes, ultraviolet (UV) levels can affect solar generation, but not in the way you’d expect.
Generally, solar panels aren’t directly affected by changes in UV light as it is different to visible and infrared light. Panels like monocrystalline panels are designed to harness that visible and infrared light and is less sensitive to UV light.
However, when panels are exposed to long durations of UV light, the panels can heat up a lot which negatively impacts the panels’ efficiency. The UV light is too energy-rich and can’t be converted into electricity, so it ends up as wasted energy which causes heat.
This heating over time can quicken degradation and decrease the lifetime of older panels and systems. More modern panels are not only more efficient but adopt new UV protective coating which greatly reduces this deterioration.
With the heat in summer periods, the UV levels are also high, which would also indicate a difference in performance between the seasons with Autumn and Spring having moderate levels of UV.
 Image
courtesy of
bom.gov.au
Image
courtesy of
bom.gov.au
Overall, no matter your system specifications or setup, your production will always vary throughout the year with different elements determining the output of your system.
Most solar systems average out to expected performance through the year with its highs and lows, but now you know how each season can affect your production.
All NSW homeowners need to know about the solar installation process - from first quote to first bill. 9 steps, real timeframes, & what to ask your installer.
Already have solar? Decide whether to add a battery, expand your panels or replace your system, and which delivers the best return in 2026.
Supply charges, feed-in tariffs, controlled load, peak rates - we explain every line on your NSW electricity bill and show you where you can save more.
Renewable News Articles
We've invested in becoming fully-licenced and qualified installers to ensure Newcastle homes and businesses
get the best systems and installations possible. We want to assist Newcastle's renewable energy revolution with quality systems.
Certified solar system installers near you.
Get CEC-Approved Battery Installations.
Fully-licenced electricians in Newcastle.
Convenient EV charging stations for properties.
Leave a Comment