Hunter Valley's Leading Residential & Commercial Solar Installers
Hunter Valley's Leading Residential & Commercial Solar Installers
Posted 20 Oct
Want the latest in energy, solar, and savings?Subscribe to our newsletter – we don’t spam!
With the recent release of the CEC H1 2026 solar & storage report, it gives us insight into the renewable industry, along with the progress of solar and battery storage throughout NSW.
This article is a breakdown into what data the Clean Energy Council found.
|
Installed |
Difference vs. Last Year |
|
| Rooftop Solar Systems |
180,878 |
+35%, up from 134,013 |
| Rooftop Solar Capacity |
1,894 MW |
+41%, up from 1,339 MW |
| Home Battery Systems |
276,011 |
+52%, up from 181,428 |
| Home Battery Capacity |
8,691 |
More than double, up from 4,221 |
| Batteries per 100 Solar Installs |
153 |
Up from 130 |
| Avg. Rooftop Solar Size |
10.45 kW |
4.5%, up from 10 kW |
| Avg. Battery Size |
Up to 35.3 kWh in April |
28.2 kWh avg. across over H1 2025. |
These figures come directly from the Clean Energy Council’s solar & battery report for H1, 2026, which uses Green Energy Markets based
on applications to the Clean Energy Regulator.
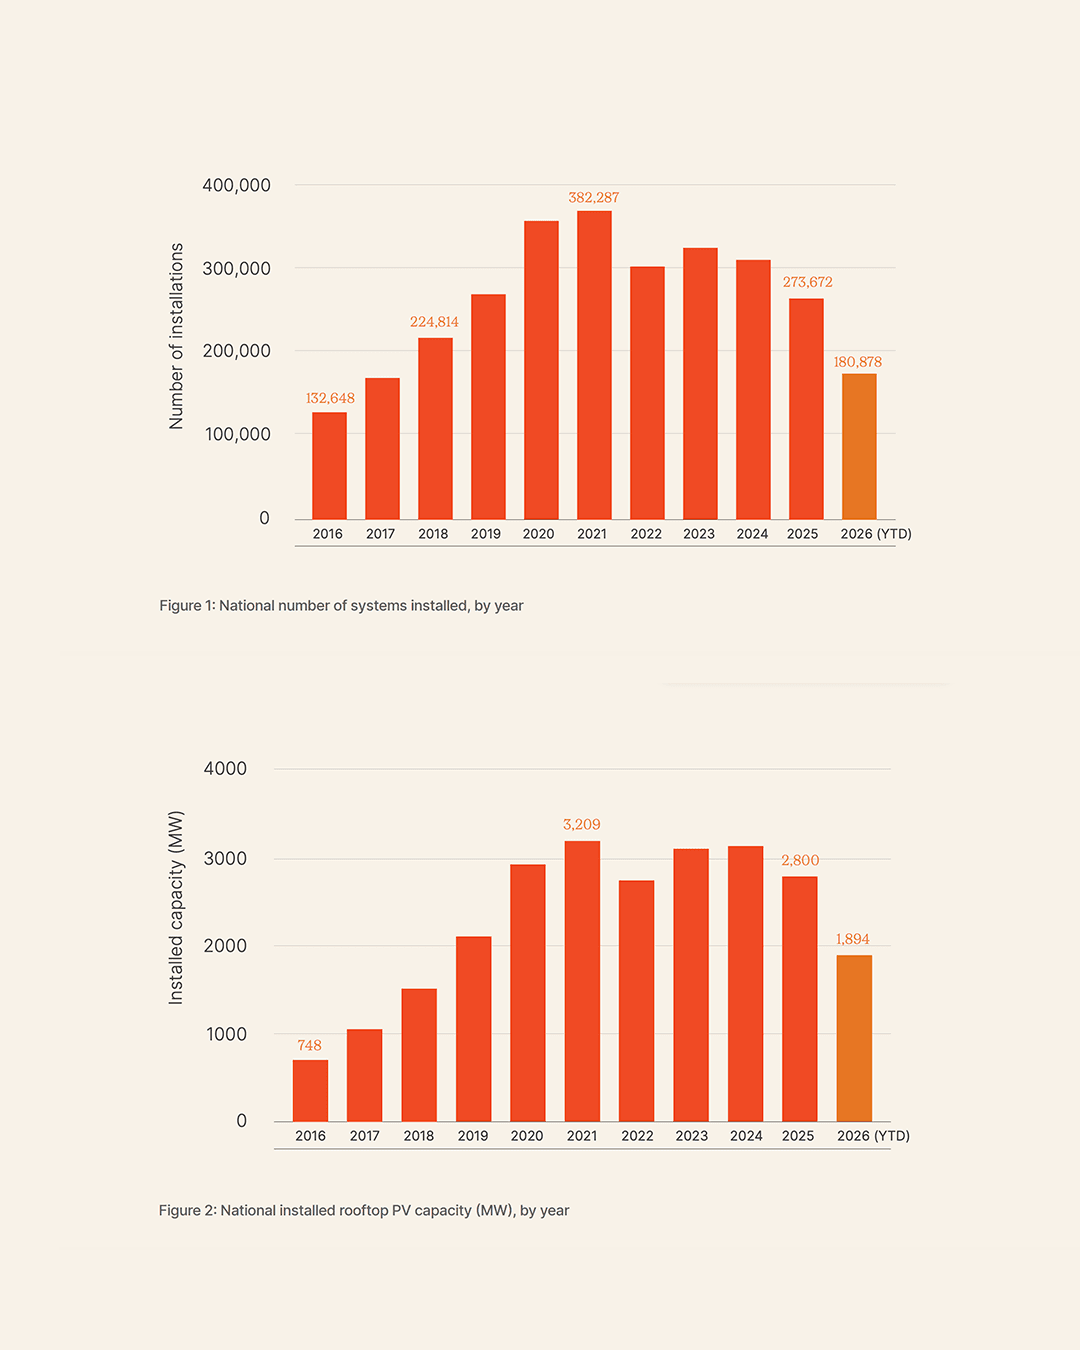
In Australia, 2025 the lowest point since 2020 where the number of installs went under 300,000, hitting 273,672 rooftop solar systems. Whilst combining up to 2,800 MW, the council’s last report suggested that solar may be past its peak.
In this report, 2026 goes against the grain, with installations reaching 35% higher than the same period in the previous year. The council says 2026 is on track to pass 300,000 again.
It’s suggested that the higher number of solar installers could be in part helped by the Cheaper Home Batteries program, where the battery discount is also bringing in new solar customers.
Since January 2019, a combination of 2.452 million solar systems have been installed, reaching 21,979 MW of total capacity.
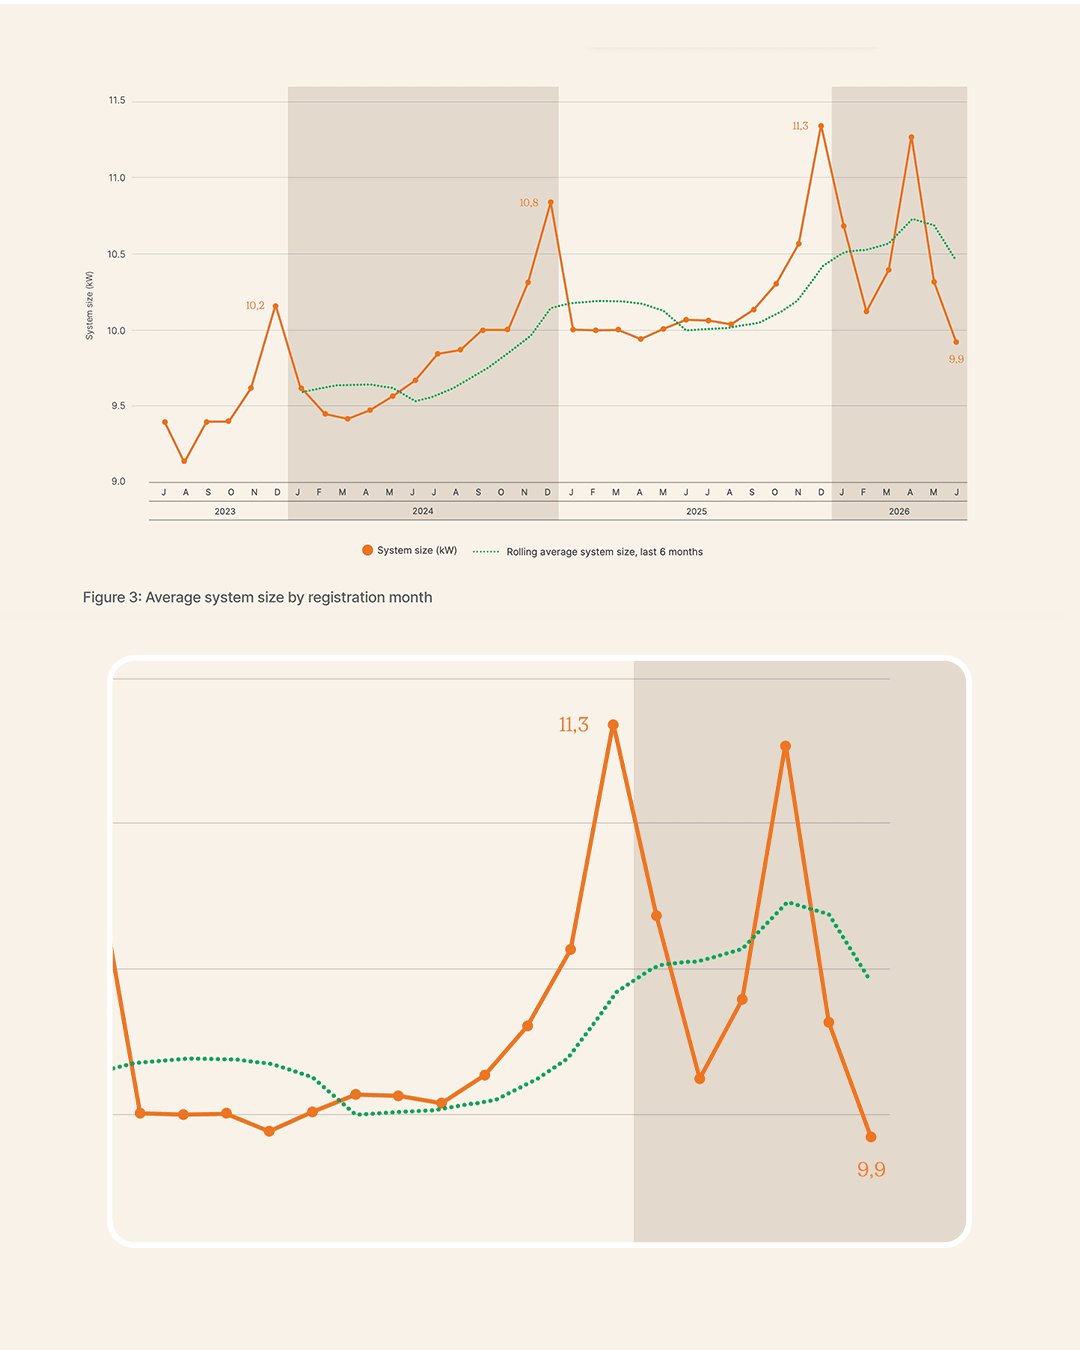
Over the years, the average solar system has been growing and even reached 11.35 kW in December 2025. However, June 2026 averaged 10.45 kW and June dropped down to 9.92 kW. The rolling average system size over the last 6 months is still at its peak however.
From January to June 2026, New South Wales added 575 MW of rooftop solar power. Queensland followed hitting 504.4 MW, then Victoria reaching
361.6 MW. June 2026 was the biggest quarter on record in every state except the Northern Territory and the ACT. NSW & QLD account for
56% of the national total since 2019.
|
STATE/TERRITORY |
Rooftop Solar Installed since January 2019 (MW) |
| NSW |
6,692 |
| QLD |
5,713 |
| VIC |
4,414 |
| WA |
2,236 |
| SA |
2,038 |
| ACT |
442 |
| TAS |
293 |
| NT |
152 |
With the Cheaper Home Batteries Program initialising on July 1, 2025, H1 2026 was its first full half year. Over the last 12 months, the program supported 457,439 battery installations, combining to reach a total of 12.9 kWh of energy storage.
Comparing quarterly figures, the installation amount has more than doubled over the period, from 70,571 in September 2025, to 154,140 in June 2026. In the first half of 2026, 276,011 batteries were installed which was 52% more than the 6-months prior.
Whilst adoption of battery storage has sky-rocketed, batteries also got bigger. In H1 of 2026, the overall capacity totalled 8,691 MWh which is more than double the last 6 months, even though the battery installed number rose 52%.
The average battery size in Australia was 17.2 kWh back in July 2025, where we saw up to 35.3kWh in April of 2026. April was the peak month
for the most battery and solar installations, with June easing down to 26.6 kWh. Over the last 12 months, the average battery size in
Australia was 28.2 kWh.
Additionally, for every 100 new rooftop solar installations in the first half of 2026, 153 home batteries were installed. That is more battery units than new solar systems which means many batteries are being added to homes that already have solar.
In the report, it mentions that household battery storage is being used primarily to maximise home solar systems, which the council says that leaves significant value unused.
They see more potential in elements like Virtual Power Plants (VPPs), flexible tariffs, and flexibility markets which are now emerging. There is value that could be transferred to households for exporting power at peak times, soaking up excess solar during the middle of the day, and helping ease pressure on the network.
Currently, the council is running a Flexibility Value Study which will measure what batteries are doing, household benefits, and how policy could improve it.
Overall, we’re seeing significant growth of renewable energy and infrastructure in Australia. The first half of 2026 we saw record 6-month numbers for both solar and battery, Australians install 180,878 rooftop solar systems, and 276,011 new batteries.
Two things stand out for households. The pace of adoption and installation is out-performing official forecasts.
This article summarised the Clean Energy Council’s Rooftop Solar & Storage report for January to June 2026. Figures are as reported.
Renewable News Articles
Sign up for new article updates - we don't spam.
We've invested in becoming fully-licensed and qualified installers to ensure homes and businesses get
the best solar, battery, and electrical systems available.
Certified solar system installers near you.
Get SAA-Approved Battery Installations.
Fully-licensed electricians Near You.
Convenient EV charging stations for properties.
Leave a Comment